The current market zeitgeist and the real risk for share investors


Last week's article on best and worst case long-term scenarios for different diversified portfolios provoked much comment on the apparent bullishness of our economic modelling. We don’t feel particularly bullish but we do appreciate that our focus on long-term valuation can cause us to be out of line with the current zeitgeist in markets. We think it’s healthy to be thinking outside the square but it does require a longer conversation sometimes and particularly now when the markets are up and down and the investment media is so bearish. We are also at the wrong end of a seven-year bull market when any contrarian investor worth his salt should be getting defensive. It’s a mixed up, confusing investment world right now.
Are we boxing at shadows?
Generally when markets are very pre-occupied by negative headlines one might conclude that all that worry is already ‘in the price’ – that means if something bad happens prices don’t move by too much as no-one is particularly shocked. But then what if everyone is thinking the same thing (that everyone else is doing the worrying for them)? Just before the GFC the then-CEO of Citigroup gained infamy by affirming that leverage could be a big problem for the banks but they were still making a lot of money so 'as long as the music is playing, then we have to keep dancing'. Citigroup had to be bailed out by the US government few months later. Then we started to hear comments like 'the music is still playing but maybe it's best to be somewhere near the fire exit just in case'. That was eighteen months ago and markets were up another 10% in the following 12 months. Markets have been flat but volatile since then. This could be a rerun of 2007-8. That said, the GFC is still fresh in every investor’s mind so if it turned to be the moment that the skies cleared and economic growth unexpectedly started to take hold then markets could easily shoot up another 30%. That feels very unlikely but in a sense that is the point. If everyone suddenly decided that real long term economic growth would be in line with the historical 3% per annum rather than say 2% per annum that could easily have that kind of an impact on prices. Stranger things have happened.
Back to Basics
If you are even more confused by now don’t worry, everyone’s in the same boat. That’s the thing about living and investing in the middle of an unprecedented market environment (very, very low interest rates for a sustained period, ageing populations, ballooning debt etc). But then again, as Yogi Berra said ‘the future ain’t what it used to be’ and it always feels unprecedented. Think of the ups and downs of the post-WW2 expansion, the 1970’s oil crisis, the economic revolution of the 80’s, the dot-com era, the rise of China and then the Global Financial crisis.
That’s why we like to get back to the basics of valuation at times like these (that is the price you are paying for a stream of future dividends). Then we adjust that price to allow for different scenarios (to how that stream of dividends might look). A few weeks ago we outlined a very simple way of estimating that price, taking into account current dividends paid by the companies in an ETF and by how much we think they will grow (the likely economic growth of that country or region minus a bit). We can then add one more parameter – the cycle of fear and greed. If investors are happy to pay an above average multiple for a dollar of corporate earnings (the price/earnings multiple) it might mean that they are feeling over-confident (greedy?). And vice-versa. Abject pessimism would lead to a below average multiple and if the investor mood was to improve then equity prices would rise. We play around with these variables to create lots of different scenarios but if we build a very simple model where earnings that have been very strong are expected to fall (a normal business cycle) and investor sentiment that has been very bullish begins to wane (a normal cycle of fear and greed) then we get a forward looking expected return for the next ten years. We can then compare that with what actually happened we get a sense of whether this is a useful way to predict what might happen to the price of a particular ETF over the next ten years. The following two charts compare the predicted return for the US and Australian equity markets with what actually happened.
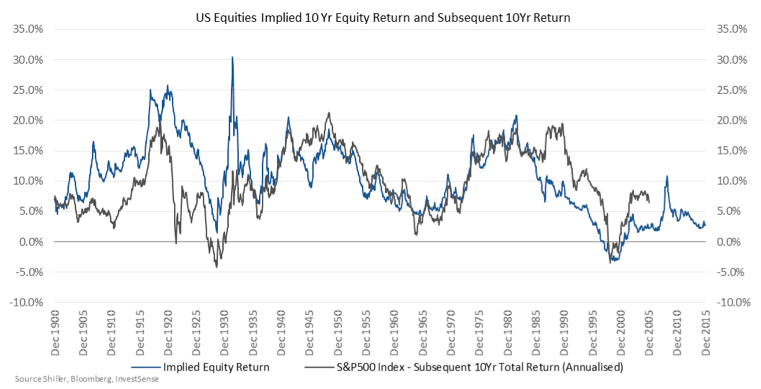
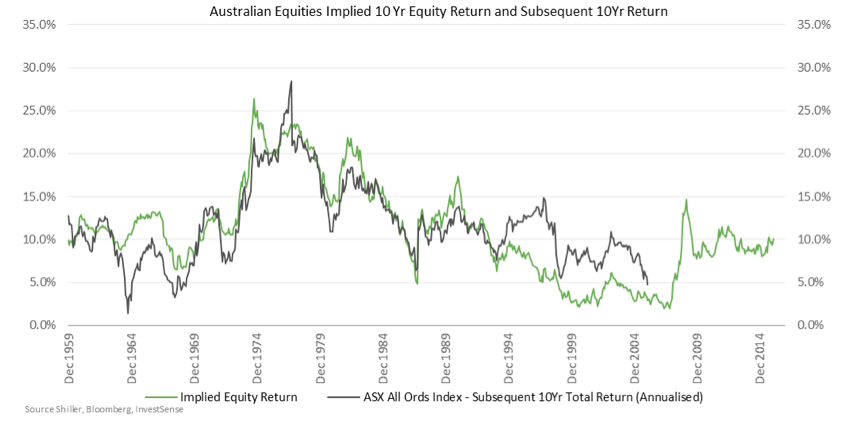
As you can see in both cases the two lines are often quite close. This has something to do with current dividend yields but also has a lot to do with the following two assumptions:
- There is a business cycle - earnings that are high tend to come down and vice versa.
- Investors over-extrapolate recent conditions so when things are good they expect that to continue. When the business cycle changes the switch from greed to fear has a reasonably predictable impact on returns.
Right now this simple model of expected returns for Australian equities suggests that annual returns for the next decade should be in the high single digits. It also suggests that US equity returns could be very disappointing.
Long-term returns, short-term risks
You might ask how much this really matters in the here and now. After all who has the patience to wait ten years? For a start this long term approach to investing might be the individual investor’s greatest advantage in markets given the notoriously short time horizon of most professional investors who are understandably more concerned with next year’s salary. Even more importantly though is what these graphs say about short-term risk. Look carefully at when the coloured line is quite low in both graphs and think about what happened next. In each case there was a market crash.
Funnily enough this actually doesn’t change much if you relax either of the assumptions mentioned above for Australian Equities. Intuitively this makes sense as we know we are not at the top of the local business cycle, even if we can’t be sure if we are anywhere near the bottom. Price/earnings multiples are also in line with the historical average suggesting that markets are neither optimistic or pessimistic about the prospects for the economy. On the other hand US equity valuations only make sense if you relax one or both assumptions. Earnings growth would need to remain strong, even after the remarkable post GFC expansion in earnings. Investors also have to remain very confident about the prospects for US Inc. These beliefs must be embedded in current stock prices, after all no-one really invests on the basis that returns will be close to zero. Therefore the short-term risk is that these beliefs are shaken by something that happens to cause investors to doubt one or both beliefs.
Theory into action
In a nutshell, that is why we are underweight in US equities and why we think the locally listed iShares ETF IVV (which tracks the US S&P 500) could fall in value by more than the ASX 200, or indeed most of the markets outside of the US, if there was another crisis in markets. It is also one of the main reasons why we also use the ETF VEU which invests in developed markets outside of the US. This is quite a good way of implementing a bias away from the US when used in conjunction with IVV. That said it is important to note that the US economy remains the largest economy and by far the largest listed market in the world. As such US equities still represent the largest allocation in overseas equities across the InvestSMART Diversified portfolios. The premise is that we think that a diversified portfolio should be, well, diversified, especially given the risks outlined above. The following tables show firstly the ETFs that we use and then how the InvestSMART International Equities Portfolio compares with its MSCI World (ex Australia) benchmark once you take into account all the underlying securities in all the ETF’s that we use in the portfolio.
ETF’s used in the InvestSMART Diversified Portfolio
|
Ticker |
Description |
% Net portfolio value |
|
AUDCASH |
Cash |
4.13% |
|
IEM |
ISHARES MSCI EMERGING MARKETS ETF CDIS 1:1 ISHMSCIEM |
9.37% |
|
IEU |
ISHARES EUROPE ETF CDIS 1:1 ISHEU350 |
12.97% |
|
IJH |
ISHARES CORE S&P MID-CAP ETF CDIS 1:1 ISHS&P400 |
15.00% |
|
IVV |
ISHARES CORE S&P 500 ETF CDIS 1:1 ISHS&P500 |
31.14% |
|
VEU |
VANGUARD ALL-WORLD EX-US SHARES INDEX ETF CDIS 1:1 |
27.38% |
|
100.00% |
||
InvestSMART International Equities
|
|
InvestSMART |
MSCI |
|
North America |
48.55 |
61.91 |
|
Europe |
25.85 |
23.65 |
|
Japan |
4.91 |
9.86 |
|
Asia Pacific ex Japan |
5.75 |
2.27 |
|
Emerging Markets |
10.76 |
2.31 |
|
Cash |
4.18 |
|
|
100.00 |
100.00 |
Note that many international equity funds will not stray markedly from the more concentrated MSCI Benchmark allocation shown on the right. This is becoming something of a hot topic and interestingly James Carlisle at Intelligent Investor wrote this week about two locally listed managers with different approaches to their US allocations. We know both managers well and they both have a strong investment rationale but unless you are going to spend a lot of time drilling down into the source of the underlying earnings we’re confident that there is a high chance that a more balanced portfolio will perform better over the long term and might just be a little less risky in the short-term.


Frequently Asked Questions about this Article…
The current market zeitgeist is characterized by a mix of bullish and bearish sentiments, with markets experiencing volatility and uncertainty. This affects share investors by creating a confusing environment where long-term valuation strategies might seem out of line with short-term market movements.
Focusing on long-term valuation helps investors look beyond short-term market fluctuations and media pessimism. It allows them to make informed decisions based on the fundamental value of investments, rather than being swayed by temporary market sentiments.
The cycle of fear and greed can significantly impact investment returns as it influences investor sentiment. When investors are overly optimistic, they may pay higher prices, leading to inflated valuations. Conversely, during periods of fear, prices may drop, offering potential buying opportunities.
The article suggests that US equity investors face risks if current optimistic beliefs about earnings growth and investor confidence are shaken. This could lead to a decline in US equity valuations, especially if there is another market crisis.
A diversified investment portfolio is recommended to spread risk across different markets and asset classes. This approach helps mitigate the impact of market volatility and potential downturns in specific regions, such as the US.
ETFs in the InvestSMART Diversified Portfolio provide exposure to various global markets, allowing for a balanced investment strategy. They help implement a bias away from US equities while maintaining diversification across different regions and sectors.
The InvestSMART International Equities Portfolio has a more balanced allocation compared to the MSCI World benchmark, with a lower concentration in North America and higher allocations in Europe, Asia Pacific, and Emerging Markets.
The historical business cycle is significant in predicting future returns as it suggests that high earnings tend to decrease over time and vice versa. Understanding this cycle helps investors anticipate changes in market conditions and adjust their strategies accordingly.


