Spread thin to gain weight


One big mystery about managed funds is the entry and exit pricing. How do they work it out? Another mystery is where exactly managed funds are invested — because if an investor doesn’t know which stocks a fund holds, how can he or she work out if the entry and exit price is about right?
Pricing sounds like a dark art and the history of entry and exit prices for managed funds tells a tale in itself.
Below is one example, the BT Australian Share Retail fund. The data starts in 1990, when it took ages to gather numbers and the share market was running hot. It’s no wonder that the entry-exit spread was much wider back then, and a drop from more than 5% in the early 1990s to 0.50% today is welcome relief to investors.
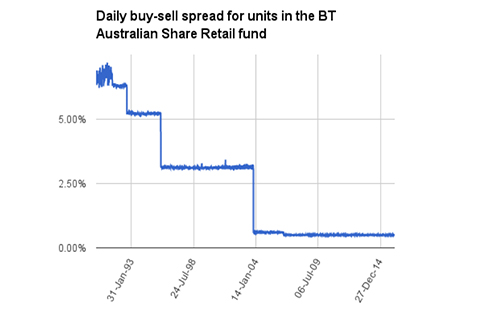
The manager of the BT fund shown here charges investors 1.72% a year and aims to beat the S&P/ASX300 Accumulation index.
WHY THE SPREAD MATTERS
The buy-sell spread is an important part of any investment decision and is often overlooked. In a game where everyone watches the price of the latest trade, the buy-sell spread is really an invisible cost. If the spread is narrow an investor will trade closer to the value of the underlying assets, which in theory will be the midpoint between the highest bid and lowest offer.
If the spread is wide, it could mean two things: there isn’t as much of a market for the asset (the market isn’t as “deep” or “liquid”) or there is some sort of interference.
The buy-sell spread, and the entry-exit price spread, is just another cost which erodes returns — but it is below the radar of many regular investors.
ACTIVE VERSUS PASSIVE
The net asset value for a managed fund like we said is a bit hard to know. Obviously it should lie somewhere between the entry and exit price. It’s a different story for exchange-traded funds, which are something of an open book.
Two exchange-traded funds that aim to track the S&P/ASX200 are State Street’s STW, which costs 0.19% a year, and iShares’ IOZ, which costs 0.15%. (Remember the fund we mentioned earlier costs 1.72% a year.)
STW has returned 4.87% annualised for the past 5 years after fees, IOZ has returned
4.49% and the BT fund mentioned earlier has managed 4.61%.
Net returns, of course, are what’s left after all the unavoidable costs and fees that come with any investment.
“The bid-offer spreads on ETFs are far narrower than the difference between application and redemption prices for managed funds,” ASX senior manager of funds and investment products Marcus Christoe told investors at the InvestSMART/ASX Exchange Traded Fund Seminar in Sydney in February.
The difference in pricing — between flabby and lean — is due to the mechanism of market makers providing liquidity. ETFs trade at or near net asset value of the underlying securities because market makers provide bids and offers in the market. “Those products trade very, very closely to NAV,” said Christoe.
NARROW NECK
It’s good news that spreads are narrowing in the world of retail managed funds, but they are still way overweight when lined up against the bid-offer spreads for the broad-based Australian equities ETFs.
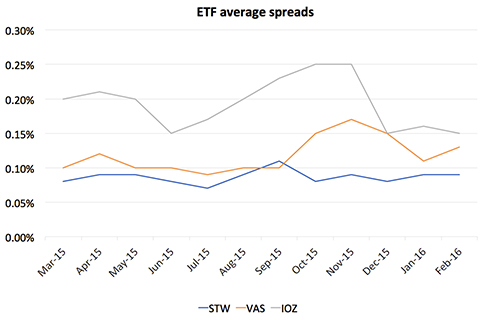
The ASX reports monthly on the average spread of ETFs in the marketplace, and the top three range between 0.09% and 0.15% — well below the 0.50% of the BT fund.
The average spreads for February for the top three Australian index ETFs were:
- 09% for SPDR S&P/ASX 200 ETF (code STW, market cap $2.8 billion).
- 13% for Vanguard Australia Shares Index ETF (benchmark ASX300, code VAS, market cap $1.3 billion).
- 15% for iShares S&P/ASX 200 ETF (code IOF, market cap $400 million).
The second chart shows spreads for the three ETFs for the past 12 months.
AND ANOTHER THING...
About 200,000 Australian investors own ETFs, making them the second most commonly traded commodity on the ASX behind direct shares. About 80% of funds invested in ETFs is retail investors’ capital, the regular investors at home who are attracted by low-cost access to entire benchmarks here and overseas.
Those people may even be more surprised to know the weighted average spread of the underlying constituents of the S&P/ASX 200 is between 0.15% and 0.20%, which is above the bid-offer spreads for the three ETFs mentioned.
Somehow, even if there were no broking costs, it’s cheaper to buy the index fund than the constituents of the index.If we can work out how the ETF providers do that we’ll let you know...


Frequently Asked Questions about this Article…
The buy-sell spread in managed funds is the difference between the entry and exit prices, acting as an invisible cost that can erode returns. A narrower spread means trading closer to the value of the underlying assets, while a wider spread may indicate a less liquid market or interference.
Managed funds often have less transparent pricing, with entry and exit prices that can be hard to determine. In contrast, ETFs are more transparent, trading at or near the net asset value of the underlying securities due to market makers providing liquidity.
ETFs are generally more cost-effective because they have lower management fees and narrower bid-offer spreads compared to managed funds. This means investors can trade closer to the net asset value, reducing the impact of costs on returns.
ETFs like State Street’s STW and iShares’ IOZ have management fees of 0.19% and 0.15% respectively, which are significantly lower than the 1.72% fee charged by some managed funds like the BT Australian Share Retail fund.
Entry-exit spreads for managed funds have decreased significantly over time. For example, the BT Australian Share Retail fund's spread has dropped from over 5% in the early 1990s to 0.50% today, providing relief to investors.
The average bid-offer spreads for popular Australian ETFs are quite narrow, with SPDR S&P/ASX 200 ETF at 0.09%, Vanguard Australia Shares Index ETF at 0.13%, and iShares S&P/ASX 200 ETF at 0.15%.
Retail investors might prefer ETFs over direct shares due to their low-cost access to entire benchmarks, both locally and internationally, and the narrower bid-offer spreads which make them more cost-effective.
The market cap of ETFs can influence their spread, with larger ETFs like SPDR S&P/ASX 200 ETF having a lower spread of 0.09% due to higher liquidity, compared to smaller ETFs which might have slightly higher spreads.


