Lucky Jim's Budget: Good for Now But Bad News Looms
I talk to some people ahead of the budget every year.
This year I thought that I’d let everyone take a look at what I’ll be saying.
There’s movement on the budget. Two years ago the deficit was at a COVID-driven peak of $203 billion.
Today it’s in surplus by $1.0 billion (over the year to March 2023 – the latest available).
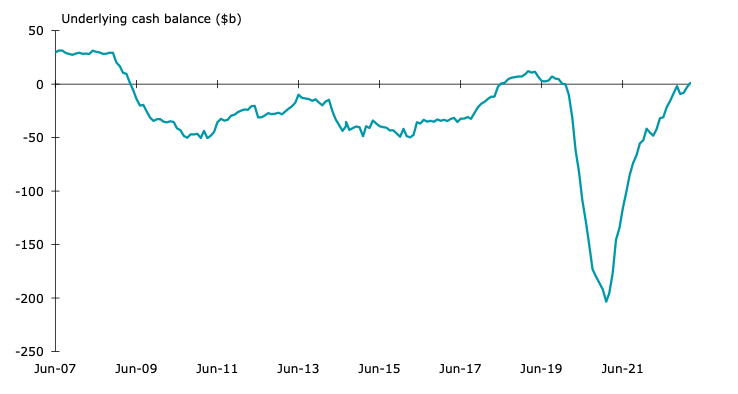
Perhaps even more amazingly, the ratio of net debt to GDP today is almost back to where it was just before COVID hit. That’s stunning …
That’s occurring because war and inflation may be terrible for humanity, but they boost both the budget (by reducing debt) and the economy (by increasing national income) – meaning that they lower the numerator and increase the denominator of debt-to-income ratios.
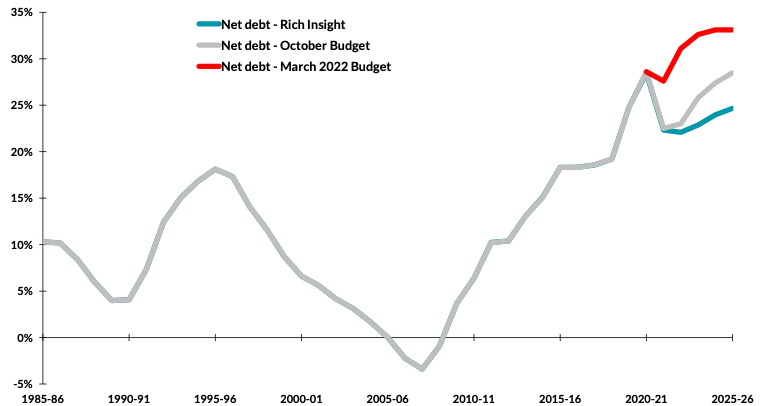
In fact that’s been pretty clear for a while now – for example, I wrote about it here, here and here.
Many people have misunderstood what’s going on. The simple summary is that a big-but-ultimately-one-off burst of inflation is magnificent news for those who owe money, because they get to pay it back in depreciated dollars.
And the Australian government entered the current burst of inflation as a big debtor. So it has been a huge winner from inflation – something that the official rhetoric and forecasts haven’t caught up with yet.
(The best example of that is the regular reference to the government’s “trillion dollar debt”. Yet net debt is $566 billion. So no, our debt is not nothing. But it isn’t what most people keep hearing it is.)
How can the news on the budget be so good when the news on the economy is not? After all, both the RBA and Treasury forecast a considerable slowdown, and I think they’re right. My own forecasts have growth in the economy (seen in the chart below) dropping to the worst seen outside of the two recessions (that of the early 1990s, and that during COVID).
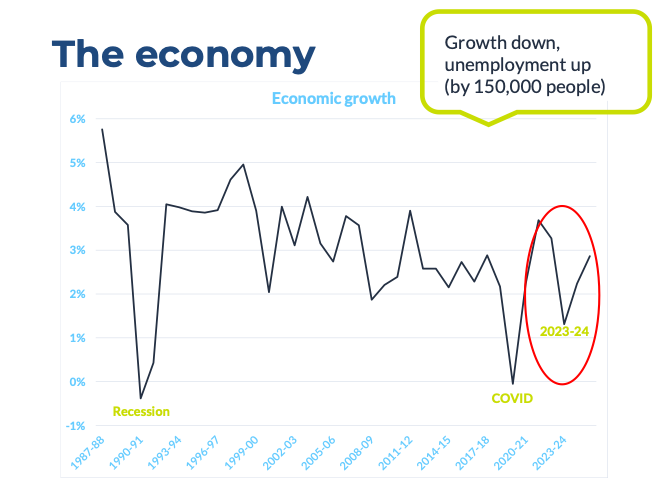
Note both Treasury and the RBA also have the ranks of the unemployed growing by 150,000 people – from the low in unemployment late last year of 3.4 per cent up to a forecast 4.5 per cent. (My own forecast is rather more hopeful on that front: I see unemployment peaking at 4.0 per cent.)
By the way, growth in Australia’s economy would be even worse still if not for the fact that population growth is roaring.
Rather, there’s a different reason why the budget is awash in money amid an economic slowdown.
It’s as simple as this: key budget economic assumptions were silly.
For example, in the 25 October budget Treasury assumed iron ore prices would drop rapidly from their then price of $US91 a tonne to $US55 a tonne by now. Yet, they’re trading today at $US116 a tonne.
And while Treasury was right to project a big fall in thermal coal prices, they’re still trading at more than three times what Treasury factored into its figuring.
That’s the key reason why, as the chart below shows, nominal GDP (which isn’t quite the same thing as national income, but I’ll call it national income here) is set to beat official estimates by some
$470 billion over the four years to 2025-26.
And yes, that’s an enormous windfall relative to the official forecasts, adding 4.4 per cent to the size of bucket of dollars in the economy.
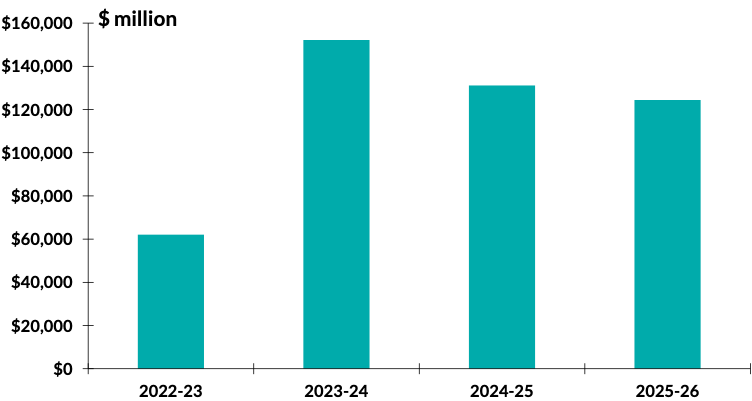
More money in the national economic bucket means more tax to be collected – that’s the close correlation you see in the next chart. On my estimates, government revenues look set to be more than $90 billion higher over the four years to 2025-26 (the period covered in detail by the budget).
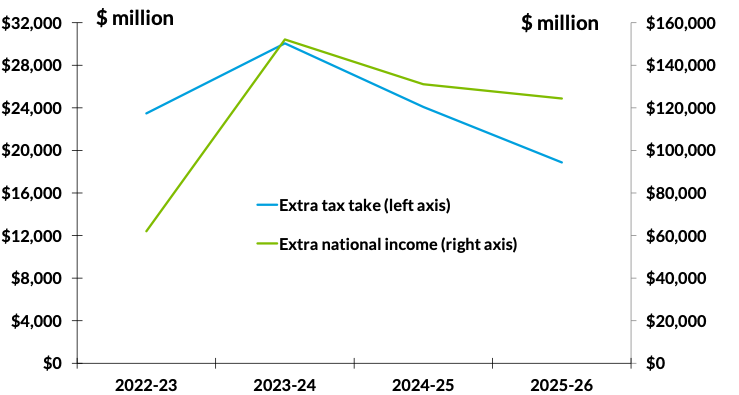
My specific estimate – and it’ll change before budget night, because the economy keeps moving – is a boost to revenues of $96 billion over and above that in the official estimates from October.
By the way, JobKeeper cost $89 billion. So you’d have thought that a casual bend-down-and-pick-it-up $96 billion extra in revenues from Treasury underestimating the size of the economy might have received a little more attention than it has to date.
Then again, that comparison uses a look in the rear view vision mirror. How about we bank this revenue revision and pay for a decade-and-a-half of raising JobSeeker to 90 per cent of the age pension?
By the way, that expected $96 billion boost to revenues from changed expectations about the economy sits atop the matching $149 billion boost that Treasury noted in the budget on 25 October.
For those of you playing along at home, the running total across a handful of months is $245 billion, or more than 10 per cent of total revenues over the four years to 2025-26.
(For what it’s worth, I estimated that figure at “more than $200 billion” back on 26 September 2022. So far, so good.)
And that says the Lucky Country has had two amazingly lucky Treasurers – Peter Costello and (to date at least) Jim Chalmers. Both presided over conditions that threw money at the tax man.
Of those two, it’s Lucky Chalmers in the lead by a mile.
Yet it gets harder for the Treasurer from here. The good news I’ve talked of here is essentially temporary. But there’s some bad news around, and it’s permanent.
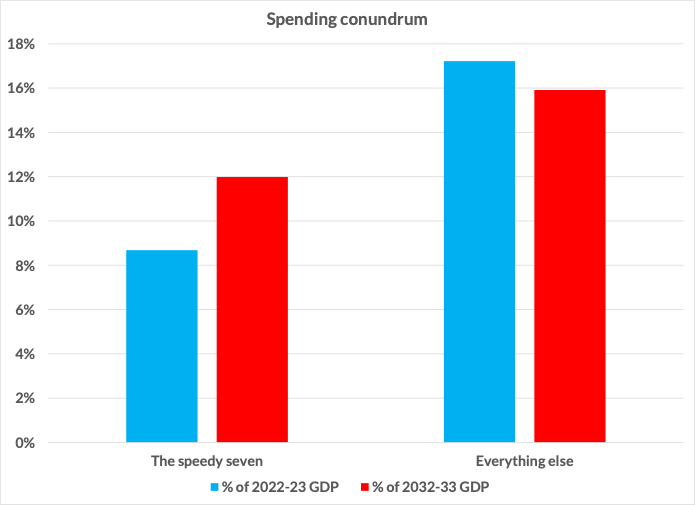
The government has identified a ‘speedy seven’ – seven areas where spending growth is really rapid.
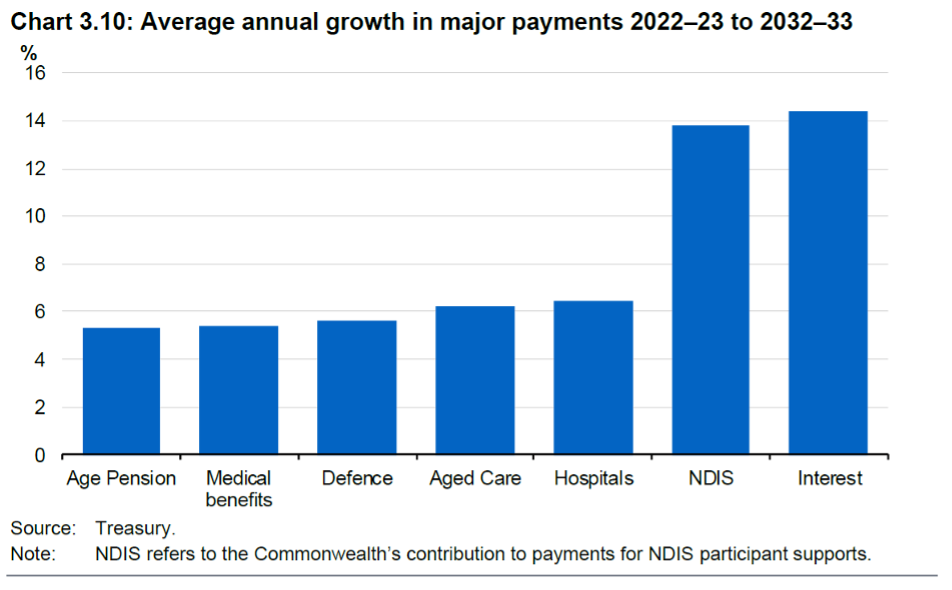
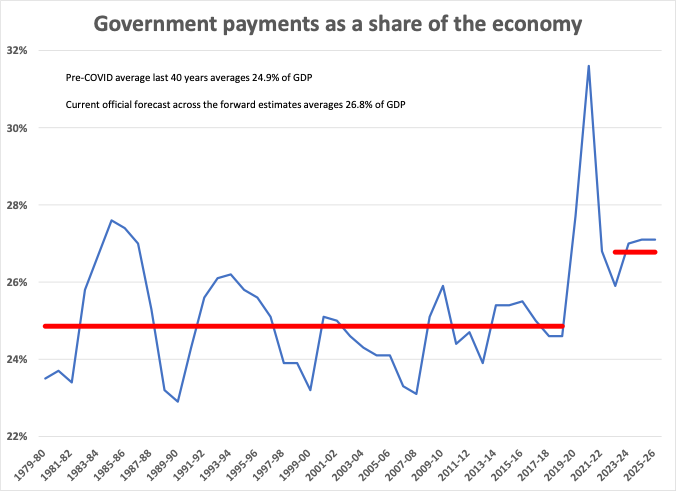
So rapid, in fact, that Treasury sees future government spending as set to be 2 per cent of national income higher than it has averaged in the past.
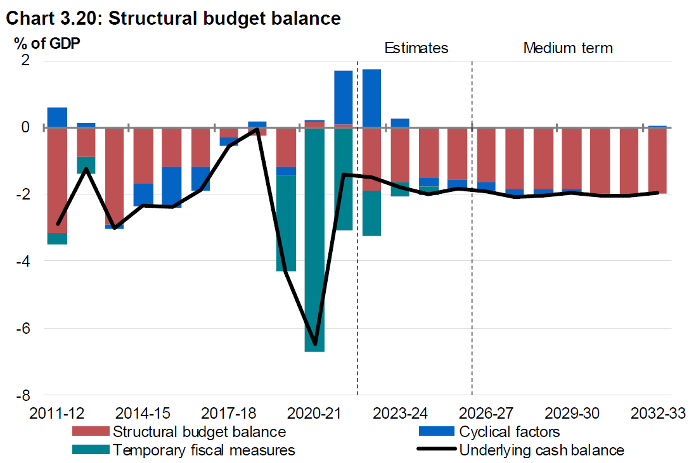
And, in turn, that extra government spending is officially expected to drive an ongoing shortfall in the budget of a matching 2 per cent of national income.
That’s the “$50 billion budget hole” you may have heard about – the equivalent in today’s money of an ongoing budget shortfall of 2 per cent of national income.
But it could be even worse than that. After all, there are known cost pressures via AUKUS, the NDIS, and the need to roll over programs such as My Health Record and the National Emergency Management Agency. And there’s been additional spending announced by the government since the October budget, including on energy subsidies (with the states), on helping Alice Springs, on the national archives, and the like. Perhaps most notably of all, there’s a need to fund the (long overdue) increase in aged care wages.
By the way, my figuring hasn’t been adjusted for possible-but-not-confirmed policies, such as the mooted changes for single mothers.
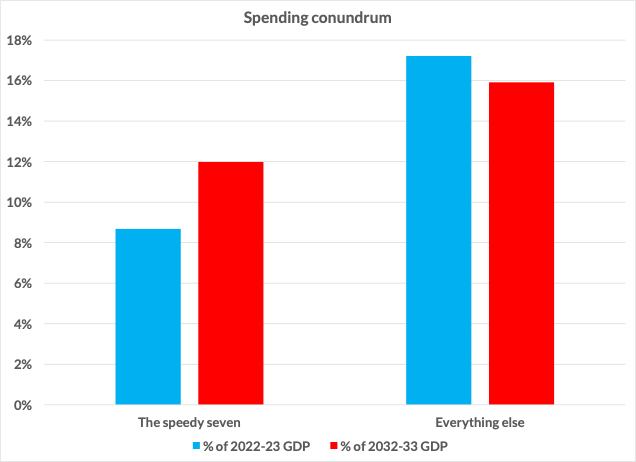
And there’s a final factor to account for here as well. Remember the ‘speedy seven’ categories of budget spending that are set to grow fast? As the chart above shows, the official figures assume that everything else in the budget gets squeezed hard enough that it shrinks as a share of the economy.
Think here of funding categories such as higher education, recreation and culture, rental assistance, and housing and community amenities … all squeezed hard.
Government spending as share of the economy
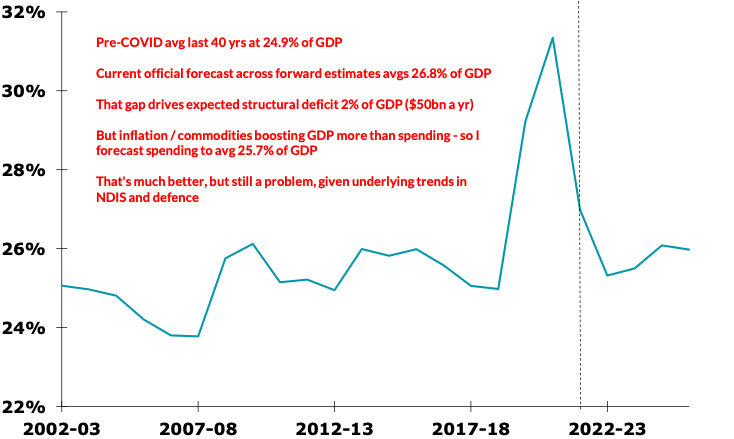
Yet my own analysis of spending isn’t quite as worrying as the official one. And yes, I’ve already allowed for a bunch of new spending – more than $12 billion over the next few years to 2025-26, including the rollovers, funding energy subsidies and aged care, helping Alice Springs, funding the national ‘trove’ and the like.
Why isn’t my analysis as worrying? There are three notable reasons for that:
- The economy is bigger, leaving spending as a smaller share of the economy
- The particular parts of national income that Treasury will revise higher aren’t drivers of extra government spending
- There are notable savings on expected interest costs in store.
A bigger economy
Remember the chart above that noted the official forecast was that spending would average 26.8 per cent of GDP through to 2025-26?
There’s a problem. That chart assumed the official forecasts for GDP, but they’re miles too low.
Think about the maths here:
- Say national income is $100.
- So the official forecast is that government spending will be $26.80 (that is, 26.8 per cent).
- But it now looks as if national income will actually be higher, averaging $104.40 instead.
- And if government spending is unchanged, then future spending won’t be 26.8 per cent of GDP – it’ll actually fall to 25.67 per cent of GDP (equals $26.80 / $104.40).
The implication? A bigger economy makes an enormous difference to our understanding of how much spending that we’re carrying.
And, in this case, Treasury’s very notable underestimate of national income implies spending that’s more than one percentage point of national income below where the official forecasts have it.
Which bits of the economy?
But spending does move with the economy. In particular, it rises if either prices or wages are higher than earlier assumed.
And it would usually be the case that the bigger economy would be due to higher wages or prices.
However, as the chart below shows, that’s not the driver here.
Cumulative changes vs official forecasts thru to 2025-26
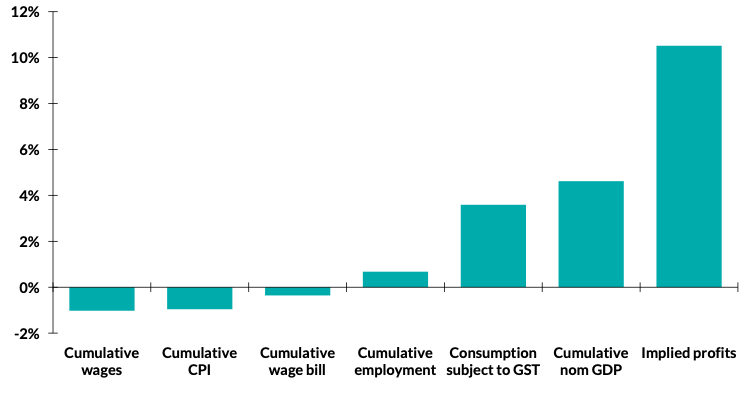
Treasury will be revising up the expected size of the economy in the main because their assumptions for bulk commodity prices – such as for iron ore and coal – have been too low. That unusual source of this revision therefore means that there won’t be much in the newly revised numbers to raise expected spending.
In fact I’m expecting wages and prices – the main drivers of government spending – to undershoot official expectations. And while higher-than-earlier-projected population (which shows up in the chart above in better-than-budgeted employment) will add to government spending, the latter boost isn’t huge.
Interesting, huh?
The government’s chart of the ‘speedy seven’ areas of spending that are galloping along was led by interest payments.
But the next revision to forecast interest payments will be downwards – and by quite a lot.
Since the October budget, likely deficits through to 2025-26 have gone down by around $100 billion, and the 10 year government bond yield is trading over the past month at an average of a little over 3.3 per cent versus the 3.8 per cent assumed in the budget.
The first factor (lower deficits) will eventually save around $3.8 billion a year versus the official estimates, and the second factor (lower interest rates) will gradually grow across the coming decade to a further saving of around $3 billion a year. Total savings are some $5 billion a year by 2025-26.
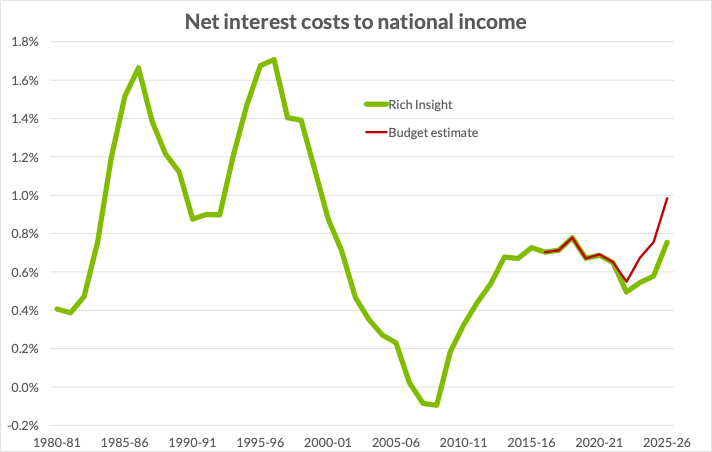
That’s why the government’s net interest payments will be a smaller share of national income this year than seen in over a decade, and it’s also why the matching average over the four years to
2025-26 will be comfortably below their average over the past three decades. (And net interest as a share of GDP in 2025-26 will equal the average incurred in the five years prior to COVID.)
Or, to put that another way, in the 25 October budget the official estimates had net debt payments climbing at a compound rate of 15.3 per cent a year over the four years to 2025-26. My updated numbers grow at a compound rate of 9.2 per cent – higher than you’d like, but about half the latest official forecast.
What does that say about total spending?
The bottom line is that future spending may be one percentage point of national income higher than it was in the past – not two.
To be clear, that still says there’s repair work to be done on the budget. It’s just that the amount of repair needed is less than the official figures would otherwise imply, as:
- They’ve been underestimating earnings from and taxes on key commodity exports, and
- Related to that, they’ve been underestimating the size of national income, and
- A one-off burst of inflation is great for borrowers, and so it’s been great for the government.
Or, if you like, although there’s plenty of tough decisions to be made, that challenge may not be as bad as earlier feared.
Smell the roses
So take a moment here to smell the budgetary roses. As I’ve been pointing out for a while now, the budget is in much better shape than generally realised, and official projections are gradually catching up with that.
Partly that’s a global phenomenon, with government finances on the improve all around the world. Inflation’s sudden surge stole from creditors, because what they’ll get back is now going to be worth less than it used to be: they’ll be repaid, but in devalued dollars. And as almost all governments are debtors, they’ve almost all been winners – with the cherry on top that revenues ride an inflationary surge better than spending does.
To be clear, the global improvement in government finances isn’t the result of everyone being better off. Inflation reshuffles the deck of winners and losers, and government wins on their balance sheet (debt shrinking as a share of their income) and their P&L (revenues rising faster than spending) are offsets by losses to creditors and to those who benefit from government spending.
The pie isn’t any bigger, but governments have grabbed a larger slice.
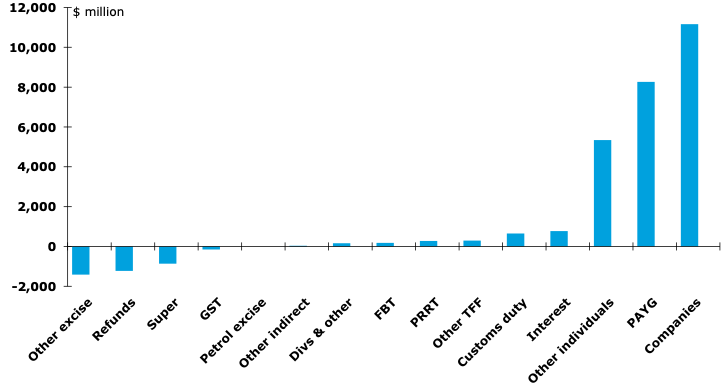
But Australia is different – the pie actually is bigger here. Australia has a bigger pie because a key driver of global inflation was Russia’s invasion of Ukraine, and that war pushed up the price of what Australia sells to the world – the biggest such boom in what the world pays Australia in over a century and a half. The upshot is that, even adjusted for inflation, national income is up by 28 per cent on pre-COVID levels. Yes, that’s huge. And it’s especially huge for the federal government. As the chart below shows, company tax collections (shown in year-to $ million terms) have been on a moonshot.
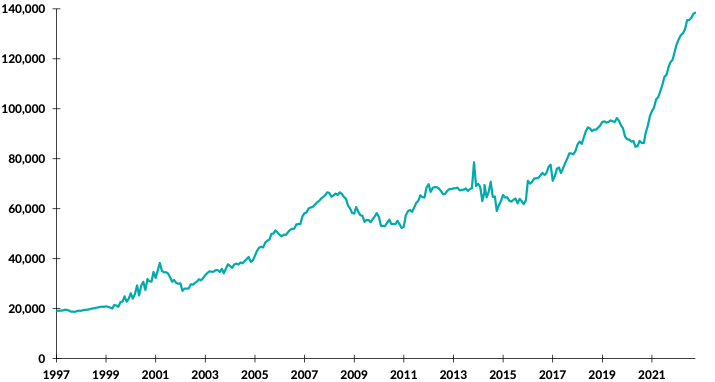
That benefit is specific to Australia. But it is a double whammy, because (1) commodity prices are stronger, and also because (2) Treasury has been assuming silly things about commodity prices.
There’s still a challenge
To be clear, there’s still a challenge. It may not be as big as the official figures have it, but it’s still pretty big.
Partly that’s because the politics of budget repair are horrendous – easy to say, hard to do.
And partly that’s because, as the Grattan Institute has pointed out (and as implied in the chart I used earlier and re-use below), the official figures assume a notable squeeze on spending outside the group of the ‘speedy seven’. In practice, future spending could rise faster in a range of categories.
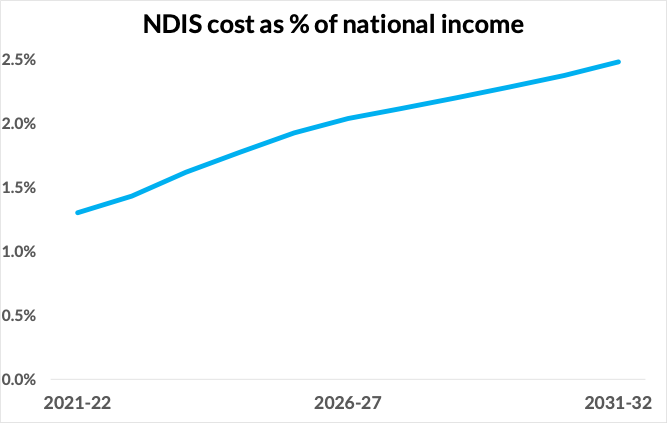
In particular, spending on the NDIS is sprinting. Treasury has notably overestimated the likely growth in spending on interest payments. But it is likely to have underestimated the growth in NDIS costs. (And the official view, as seen in the chart below, is already worrying enough.)
That shouldn’t be a surprise. At its core, economics is a study of incentives. And just about every incentive in play in the NDIS is wrong:
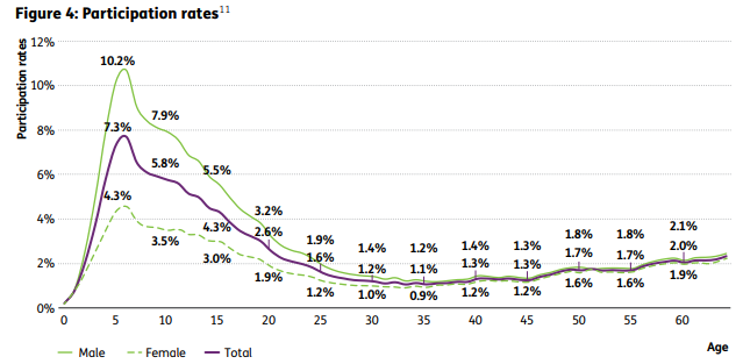
- It is notably more generous than competing programs – not merely with extra dollars, but also a lack of any means testing. That means individuals have an incentive to move off other programs on to the NDIS. As doctors are the gatekeepers, that means there’s an incentive to ‘doctor shop’. And that combination is a hothouse environment for frauds and rorts. In turn, that has led to a situation in which more than one-in-ten boys aged 5 to 7 are in the NDIS (as seen in the chart below).
- The NDIS is also much more generous than related State programs. Add in the fact that the States pay only a small and falling share of NDIS costs, and the States too have an enormous incentive to switch people on to the NDIS.
- There’s more. Not just individuals and the States, but also other Commonwealth departments have an incentive to shift people and costs on to the NDIS.
- Similarly, a decision by the NDIS to say ‘no’ to requests by participants for more funding can be appealed in a variety of ways.
- In addition, cost control is both partial and patchy, with a focus on inputs rather than outputs. Add in tight job markets, and the result is that “profits in the [NDIS service provider] sector grew more than 29 per cent on average every year since 2018”.
- The NDIS began with an investment ethos – with an intent to not only care for the disabled, but also to help them to be in a position to work. And so the NDIS was designed to pour massive amounts of funding in upfront, but doing so with the aim of producing net savings over a lifetime.
- However, because it is run on a welfare mindset rather than a welfare-and-investment mindset, the spending spigots remain fully open, average spending per participant (already very high – see the next chart) is going up fast, and outcomes don’t seem to be getting better (employment for participants and their carers, levels of daily life functionality, and the like.)
- Related to that, participants are joining the NDIS, but they aren’t leaving. With so many of the incentives being wrong, people aren’t ‘graduating’ from the NDIS.
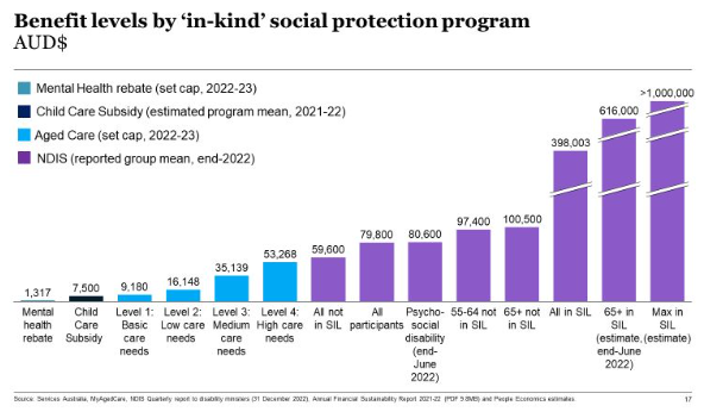
There’s no easy out here. But at the moment the NDIS is on track to fail both the disabled and taxpayers. And, as it is even harder to take benefits away once they begin to be received, large scale reform is needed earlier rather than later – delay would be very expensive.
There are other areas of spending ripe for reform too. The WA GST deal should be taken into a dark alley and disposed of. Medicare management is leading to waste and fraud.
And the list goes on …
Savings on the tax side?
OK, the above noted the potential to save money on spending.
We can and should do better on tax too. I’ve written a lot about elements of this list, so I won’t labour the detail here:
- Trim Stage 3 by keeping 37 per cent rate
- Rework the Petroleum Resource Rent Tax (PRRT)
- Quadruple the bank liabilities tax
- Drop CGT discount from 50 per cent to 33 per cent
- Crack down on trusts
- Keep the Superannuation Guarantee rate at 10.5 per cent and, over time, increase the super preservation age to 65
Note that the above tax hit list did not include …
- Negative gearing (it’s a symptom of other problems, not a rort in itself)
- Fuel tax credits (we need a carbon tax instead)
- Resource taxes outside PRRT (battle is lost, and royalties have lifted a lot)
- Complete abolition of Stage 3 (there are babies in that bathwater).
Policy and the fight for fair
By the way, the huge potential savings on offer from better taxes and more focussed spending would allow the government to both walk and chew gum.
That is, it would allow it to both:
- Achieve budget repair, and
- Lift JobSeeker.
Yes, I know it’s harder to do both at the same time, as lifting JobSeeker costs money. But it’s also a strikingly cheap way to achieve a fairer Australia.
Policy and the fight against inflation
Let’s chat about the Low and Middle Income Tax Offset (LMITO).
There’s been excitement about the disappearing LMITO in recent weeks, so it is worth drawing out different implications from different viewpoints:
- tax policy,
- managing the economy, and
- politics
In brief, the demise of the LMITO is good tax policy and it helps control inflation.
But it’s an absolute exploding cigar in terms of its political impact.
(So, as usual, good economics and good politics are pulling in different directions.)
In terms of tax policy, LMITO was stage 1 of a three stage personal tax change.
To be clear, the benefit LMITO gave to taxpayers will live on. The bit that’s about to disappear is actually the bit that was doubled up (to help fight COVID) and then added to even further (to fight the election).
And yes, those extra bits should disappear. There is indeed a case to trim the stage 3 tax cuts, but that’s mostly because they’re too big. However, there’s much less of a case to keep the extra tax cuts for low and middle income taxpayers.
By the way, much of the misunderstanding here comes from the name.
LMITO doesn’t actually go to low and middle income earners. It goes to low and middle income taxpayers.
And that’s a very different group.
Remember that half of the adult population doesn’t (and shouldn’t) pay personal income tax, as their income is too low.
Think the unemployed, pensioners and students.
So, if you’re a taxpayer, then you’re already in the top half of income earners in Australia.
And then LMITO goes to most personal taxpayers – about four in every five taxpayers (though it didn’t benefit either the lowest or the highest earners among taxpayers).
Or, to put that another way, LMITO goes to the top half of income earners in Australia, with the exception of the 7 per cent of adults who earn too much to qualify.
So no, notwithstanding its name, this doesn’t go to low income earners.
Hence keeping LMITO wouldn’t make Australia fairer in the way that lifting JobSeeker would.
But wouldn’t keeping LMITO going help with cost of living pressures?
Yeah, nah …
At a cost of about $11 billion, keeping it going would certainly hand heaps to middle Australia.
Yet, as noted, it wouldn’t help the bottom half of income earners in Australia. So if you really want to help those most in need, then LMITO isn’t the right tool to do that.
(Spending is the almost always the best way to fight for fair – tax usually isn’t.)
Worse still, dropping an extra $11 billion back into an economy still wrestling inflation down would be a rather dumb thing to do.
Why? The rough rules of thumb coming out of economic models suggest the true choice facing Australia isn’t keeping the LMITO going or not.
Rather, it is (1) dumping LMITO as planned or (2) keeping it going PLUS having interest rates half a percent higher than otherwise.
So keeping it wouldn’t be a free lunch – sorry.
Rather, in terms of managing the economy, dropping LMITO widens the list of inflation fighters:
- By number, the largest group of inflation fighters are wage earners. Wages aren’t keeping pace with rising prices.
- The most affected group are borrowers. They’re paying much more for their loans.
- Dropping LMITO adds taxpayers to the list of inflation fighters.
And a wider base of groups fighting inflation is a good thing – it shares the pain better.
So dropping LMITO as planned is both good tax economics and good macroeconomics. What it isn’t, however, is good politics.
Now I’ll admit politics isn’t my strength. But it isn’t unusual for good politics and good economics to be rather different.
And here’s the thing – people will see the pain in their pockets from this year’s smaller tax refunds / higher tax bills as a result of the loss of the LMITO. After-tax incomes are about to take a hit, down just over 2 per cent for those on $37,000 or $90,000. The pain peaks at a loss of 3½ per cent for those on $48,000.
(The benchmark here is that wages grew 3.3 per cent in the past year, so millions of people will see up to a year’s worth of wage gains eaten up in higher tax.)
Or, to put that another way, announced federal government policy will put $1.5 billion into peoples’ pockets via electricity subsidies, but remove $11 billion via higher personal tax.
As noted above, that’s good tax policy, and it helps with the fight against inflation – it’s the right thing to do.
Yet it’s less good politics, with more than $7 out of pockets for every $1 that goes back in.
My guess is that’s why the Treasurer is flagging that he won’t bank every dollar of windfall from current commodity prices – chances are he’ll be under political pressure to be seen to do more.
Budget rulz
Speaking of which, the October budget laid out some budget rules. Specifically, these were:
- “Allowing tax receipts and income support to respond in line with changes in the economy and directing the majority of improvements in tax receipts to budget repair.
- Limiting growth in spending until gross debt as a share of GDP is on a downwards trajectory, while growth prospects are sound and unemployment is low.
- Improving the efficiency, quality and sustainability of spending.
- Focusing new spending on investments and reforms that build the capability of our people, expand the productive capacity of our economy, and support action on climate change.
- Delivering a tax system that funds government services in an efficient, fair and sustainable way.”
That was correctly characterised as “the weakest fiscal strategy of recent times“.
A quick focus on Rule 1 is handy here.
As mentioned earlier, Peter Costello oversaw economic conditions that showered rivers of gold into Canberra’s coffers. Yet Costello wasn’t Australia’s luckiest ever Treasurer: he rates a distant second to Lucky Chalmers. The budget in October saw Treasury revise revenues up by $149 billion due to better than expected conditions, and the coming budget should add another $90 billion or so to that.
That’s stunning. The latest loose change found down the back of the Tax Office couch more than pays for JobKeeper. And, added together, the revenue write-ups of last time plus this time total well over $200 billion, thereby boosting revenues by more than 10 per cent across the four years through to 2025-26.
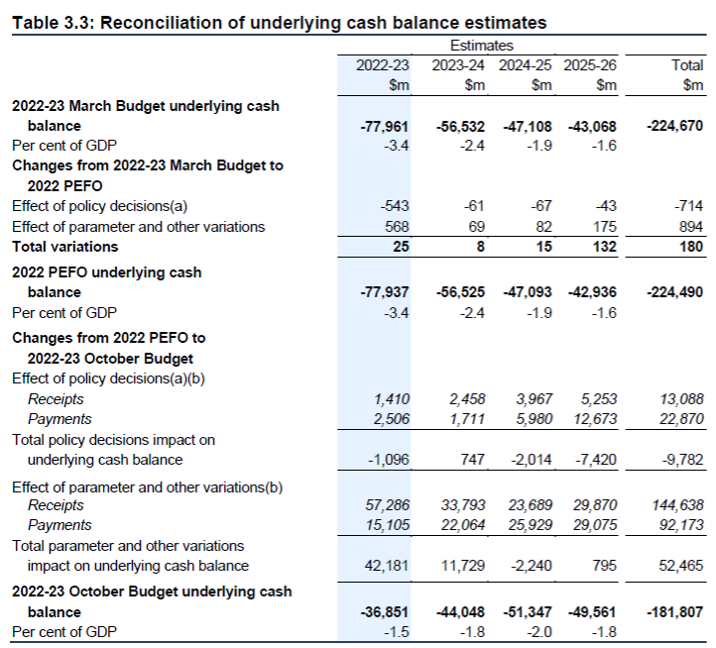
Yet, to date, the government’s decisions have added to deficits. Those decisions had already worsened the bottom line through to 2025-26 by almost $10 billion as at the October budget (see the circled number below), and that figure has probably doubled since then.
Yes, there are great reasons for those decisions to worsen the budget bottom line to date, including everything from fulfilling election promises to rolling over existing programs without future funding.
Yet, as excellent as those reasons are, at some stage the rhetoric around budget repair needs to be backed by action.
Instead, to date budget policy has been loosening despite (1) an inflation challenge and (2) a need for budget repair over time.
The technical term for that is “a mistake”.
And Rule 1 doesn’t stop that mistake happening, because it’s been happening at a time when the economy – mostly thanks to strong commodity prices running roughshod over Treasury’s silly forecasts for them – has been handing dollars to the taxman.
In effect this government has been repeating the same mistake made by the Howard / Costello government, locking in extra permanent decisions that weaken the ongoing budget bottom line at a time when revenues are booming.
To be fair, Howard / Costello added lots, and to date this government has added relatively little.
By the way, the government claims that it “saved 99 per cent of [the benefit that the economy delivered to the budget] over two years in the October budget and 92 per cent over the forward estimates”. That ratio is best measured using the above table. I indeed get 99 per cent over the first two years, but only 81 per cent (equals one minus $9,782m / $52,465m) over the entire four years.
And in the final year above – 2025-26 – the economy delivered the budget a gain of $795m, but policy decisions cost $7,420m, meaning the government spent more than eight times what the economy gave it.
Moreover, this government’s policy mistake of the moment seems to be worsening: this article notes the government’s intention to save relatively less of the extra rivers of gold this time than it did last time.
The Treasurer’s reasoning is that the inflation challenge is less than it was, and that the economy is now slowing. And both of those things are true. Yet they’re not good reasons to loosen budget policy further. Were the government to make net policy savings, then that could:
- still help inflation (which is likely to be above target for quite some time yet), without
- hurting the economy (because it would allow the RBA to have interest rates lower than they’d otherwise be).
Even better, it would help to address the longer term task of repairing the budget.
If nothing else, it would be good to see better budget rules announced on budget night.
The current ones are too weak, and the government is already driving trucks through its own rules.
Perhaps most notably, the key rule – rule 1 – says it will direct the majority of improvements in tax receipts due to changes in the economy to budget repair.
But here’s the thing. Economic conditions are currently delivering the most favourable environment to the budget in a century and a half – hence my use of the nickname Lucky Chalmers.
Yet the next big move in commodity prices is down – Treasury may have consistently overegged that in their forecasts, but the direction will eventually indeed down.
Or, in other words, Rule 1 isn’t merely too soft, it will also have a very short shelf life. It doesn’t tell us what the government will do when Lucky Chalmers runs out of luck …
The who, why and what of JobSeeker
I have spoken and written about JobSeeker a great number of times.
Yes, raising JobSeeker would add almost 1 per cent to federal spending. But it would also have a remarkable impact on fairness.
Or, to put that another way, it’s a strikingly cheap way to achieve a fairer Australia.
We should do it.
To be clear, I’m also in favour of budget repair. Repairing the budget can help take pressure off the Reserve Bank (a near term benefit), and help with the politics and the economics of fighting a future crisis (a longer term benefit).
Yet the need to repair the budget is in no way an argument not to fight for a fairer Australia. It simply says the task is harder – we have to pay more to the unemployed, and so we have to work harder to repair the budget.
That simply means parliament has to walk AND chew gum.
I’ve met many retired politicians who very much agreed that JobSeeker should have long since been raised. So why weren’t they part of raising it while they were in parliament?
Danielle Wood of the Grattan Institute makes the point here that raising JobSeeker simply isn’t popular with the public. And, as she notes, that’s because public opinion harbours a range of myths about JobSeeker.
The first is the ‘who’. The public imagine that the typical person on unemployment benefits is young, fit and lazy – happily reliant on government welfare to finance their surfing odysseys along Australia’s coastline.
Umm, no.
The biggest group of those on unemployment benefits are those aged 55 to 64. The second biggest group is 45 to 54. Then 25 to 34, followed by 35 to 44. And then … those under 25.
By gender, the largest group is women aged 55 to 64.
So the ‘who’ of JobSeeker is absolutely not the stereotypical young ‘bludgers’. It’s actually older Australians.
In turn, that raises the ‘why’.
The demographics of JobSeeker have changed as policies have changed over the years. In particular, many people who in earlier years would have been on disability support are now on JobSeeker – because it’s the ‘last benefit in the queue’.
That’s why almost half of those on JobSeeker have only a “partial capacity to work”. And many lack the skills and education that could otherwise help them get a job.
Then, finally, there’s the ‘what’. Those on JobSeeker aren’t the stereotypical young bludgers of popular imagination. In part it is hard to bludge when JobSeekers have to regularly apply for jobs, study and train under a series of ‘mutual obligations’.
And, as Professor Peter Whiteford’s work (as seen in the chart below) reminds us, ‘bludging’ doesn’t get you far in Australia. With the sole exception of Greece, the gap between what you receive on JobSeeker and what you can earn if you get a job is lower in Australia than it is in other wealthy countries.
Or, in other words, this nation is extremely ‘tough on bludgers’.
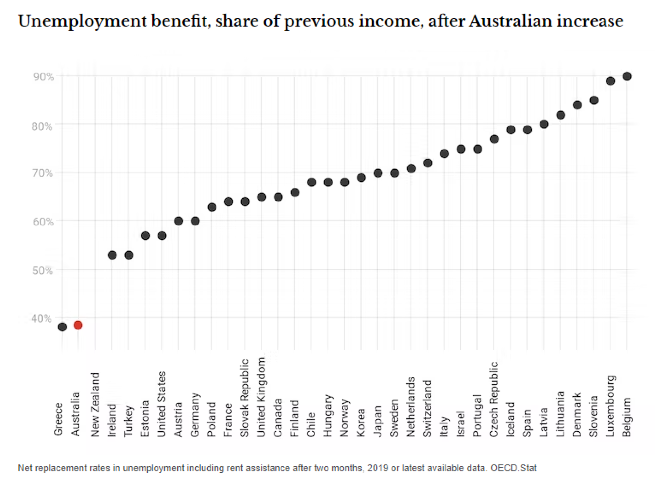
But those myths continue to get in the way of better policy here. And because the public misunderstands the who, the why and the what of JobSeeker, we end up in a terrible place. Or, as Danielle Wood puts it, “in our efforts to stop a single dollar landing in the hands of the undeserving, we have pushed almost one million of our fellow citizens into a financially precarious position”.
Yes, that does sound like what you see in America, doesn’t it?
We can and should do better than that.
Budget bottom lines
I’ve saved the best for last: the bottom line.
Winter is coming for the economy, with a slowdown gathering pace.
However, the news on the budget – and on debt – remains much better than the official projections in the October budget.
In the main that’s because Treasury assumed that an epic commodity collapse was imminent.
However, it hasn’t arrived. And although commodity prices will trend downwards, that may not happen in anything like the rush that Treasury assumes. Add in higher-than-budgeted population levels, and the economy is set to be hugely bigger than Treasury had assumed – by a cumulative $470 billion over the four years to 2025-26.
That’s an economy – the bucket of money that gets taxed – which is 4.4 per cent bigger than Treasury allowed.
The usual rules of thumb would say an upward revision of that size would add almost $120 billion to total revenues over four years. But my own estimate – $96 billion – is rather less than that, in part because Treasury seems to have allowed for larger dividends than I’d expect from the Reserve Bank.
To be clear, although Treasury will revise in these same directions – bigger economy, higher revenues – on budget night, their revisions won’t go as far as mine. However, that’s because Treasury has a considerable incentive to keep a ‘hollow log’ to draw upon if needed, and overly weak commodity price assumptions help it to do exactly that.
The story on spending isn’t huge. There’s a bunch of spending on new policy, but there’s also a bunch of savings from lower interest payments than Treasury has factored in.
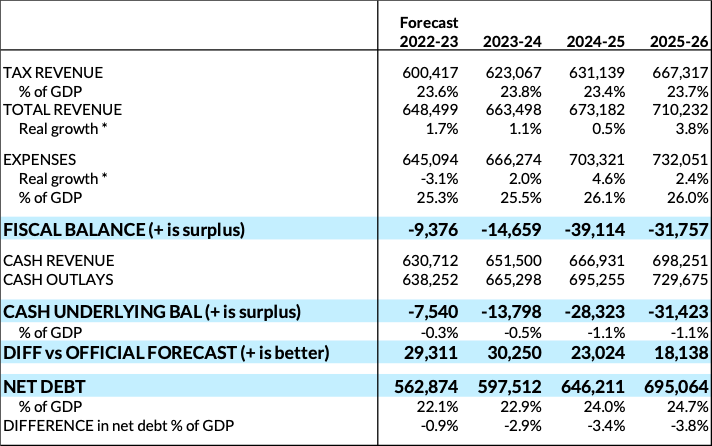
My key forecasts are in the table above. Again, they’re not what Treasury will say on budget night, but I’m happy with them.
Deficits rise over time, from $8 billion this year, to $14 billion next, and then $28 billion in 2024-25 and $31 billion in 2025-26.
This year’s deficit of $8 billion (or, to be exact, the $7.54 billion seen in the second blue line in the above table) improves mostly because profits are far higher than Treasury imagined, but also because better-than-expected population growth is combining with a resilient job market.
That combination leads to revenues beating the official forecasts for them in the current year as per the chart below.
And, in total across the four years to 2025-26, I forecast deficits that are $101 billion smaller than Treasury projected in the October budget, with $60 billion of that improvement coming in this financial year and next (see the third blue line in the above table).
And that improvement is coming despite the $12 billion in net new spending that I’ve allowed for.
Net debt to GDP, currently back close to pre-COVID levels, will rise gently in the years ahead, but remain rather lower than the current Treasury projection (and, even in mid-2026, it will still be more than $300 billion below the “trillion dollar debt” mantra that has grabbed the national attention – see the last blue line in the above table).
So there’s lots to celebrate. And we should celebrate it – it’s stunningly welcome.
Yet we’re very close to the moment at which you’d declare “this is as good as it gets” for the budget.
The economy is currently kinder to government finances than at any other time in the century-and-a-half since gold rushes dominated the economies of the colonies.
Yes, that’s welcome. But it’s also a considerable concern, as it says the coming trends won’t be our friend.
Although his budget numbers have been out by a country mile, the basic message that Treasurer Chalmers has been stressing is entirely correct – the good news of the moment is temporary, whereas the bad news is here for the long haul.
Yet that’s the exactly the point. The budgetary backdrop that Australia faces – good now, bad later – says that we should act today to prepare for tomorrow.
However, that’s not what we’re doing. To date this government has been strikingly gradualist. Aside from a handful of areas, it isn’t tackling problems – it’s hoping they’ll go away.
Maybe they will go away: at least from the viewpoint of the federal budget, the Lucky Country has never been luckier than we’ve been in the last few years.
But maybe they won’t. And although luck’s a fortune, it’s not a strategy.


