Last decades teachings in four charts


However, as this chart shows, it’s not the only asset class that has created wealth. On a total return basis, equities are neck and neck with property.
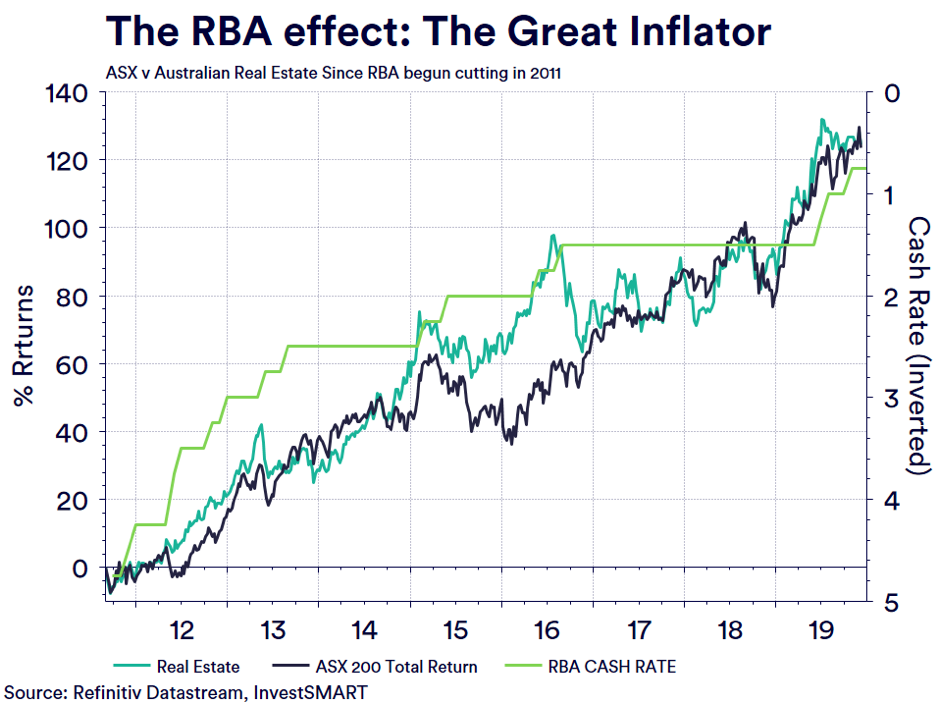
The chart also illustrates the effect the RBA has had on the property and equity market. As the Board cut rates from 4.75% in October 2011 to the current rate of 0.75%, it has inflated the core investment assets of Australian investors.
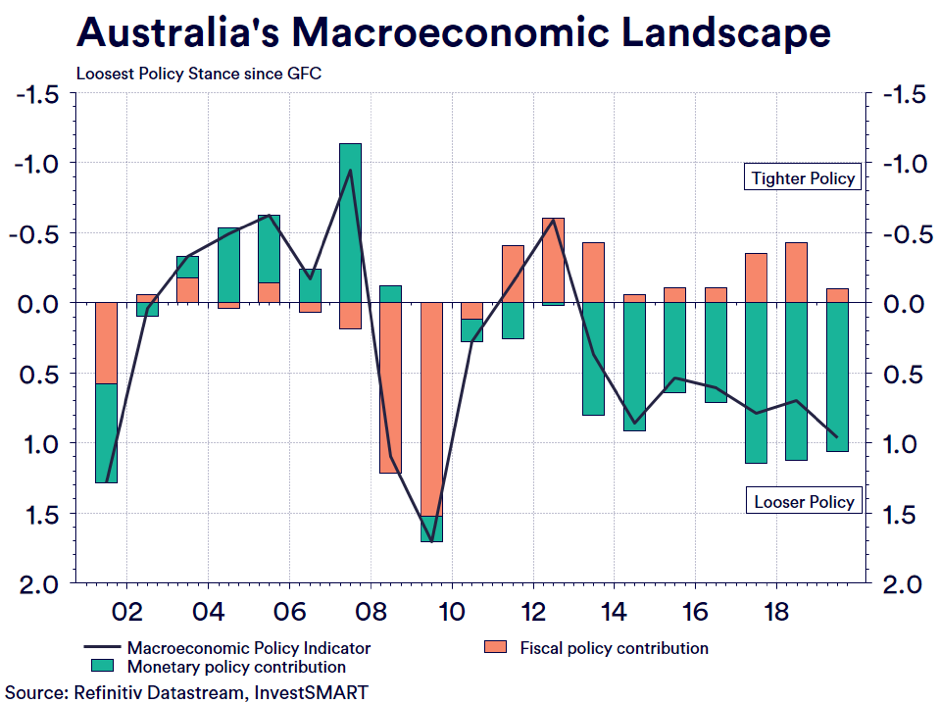
The RBA has been doing all the ‘lifting’ around asset prices. It has its ‘loosest’ policy stance in its history. Loose means policies designed to stimulate the economy and create inflation. This loose policy stance now sees the overall public policy stance of the country (including government policy) at its loosest level since the peak of the Global Financial Crisis (GFC).
However, in Australia, cash and equity investors like their returns in not just capital returns but also in ‘cash parcels’, whether its Term Deposit (TD) holders or Equity investors, where dividends have been the aim of the game and Australian securities have obliged.
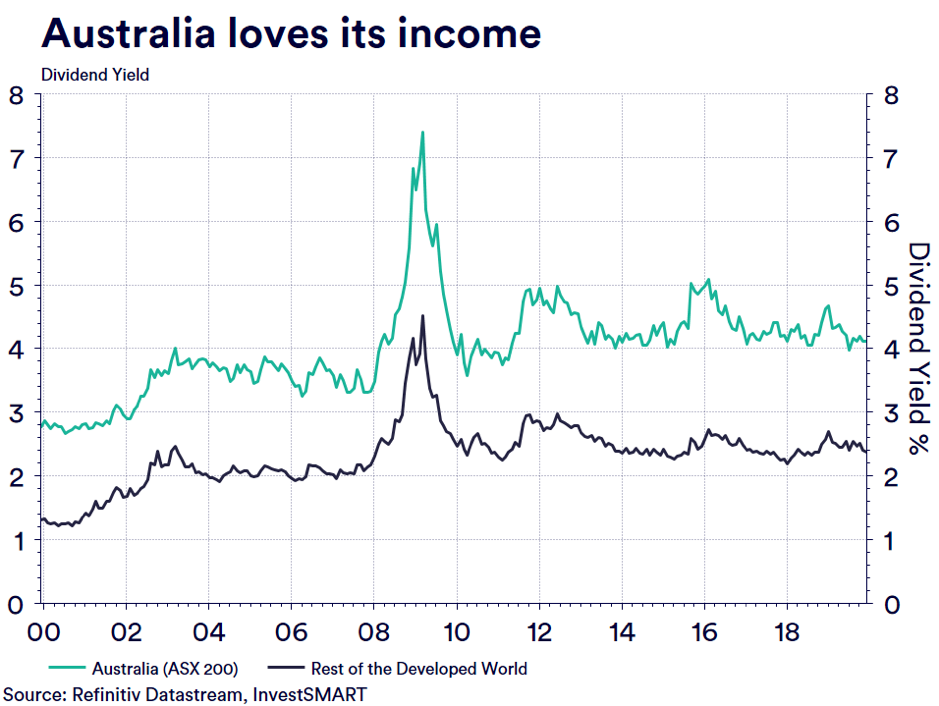
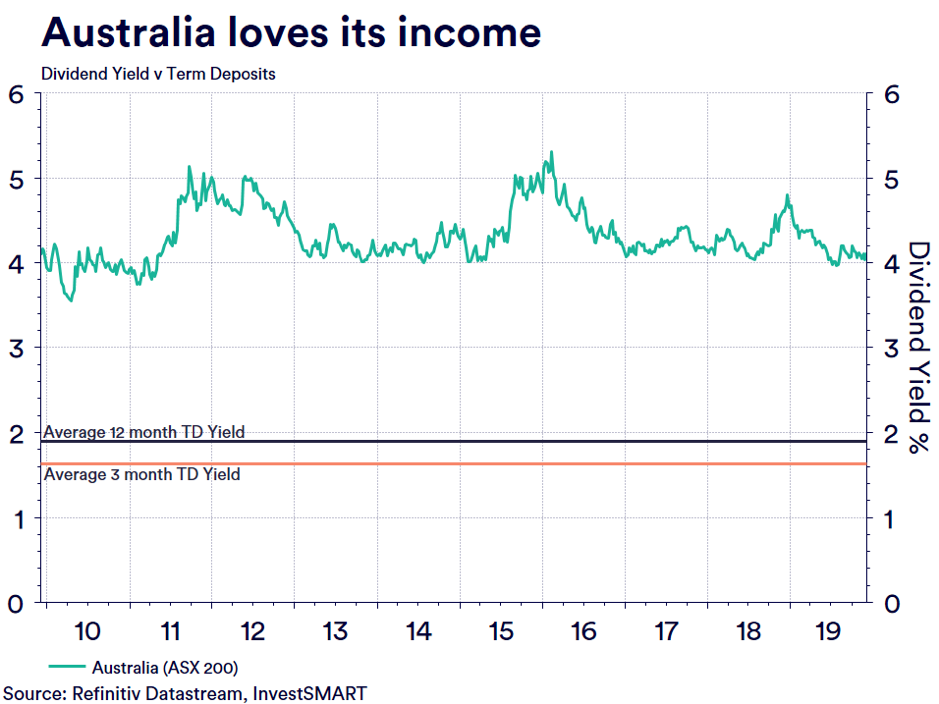
That ‘gap’ between the yield of the ASX and the rest of the developed world won’t close anytime soon. Your dividends will keep coming. But why we illustrate this is, as the cash rate has fallen, so too has the yield on offer from TD’s, they are now at record all-time lows and well below the yield in the ASX.
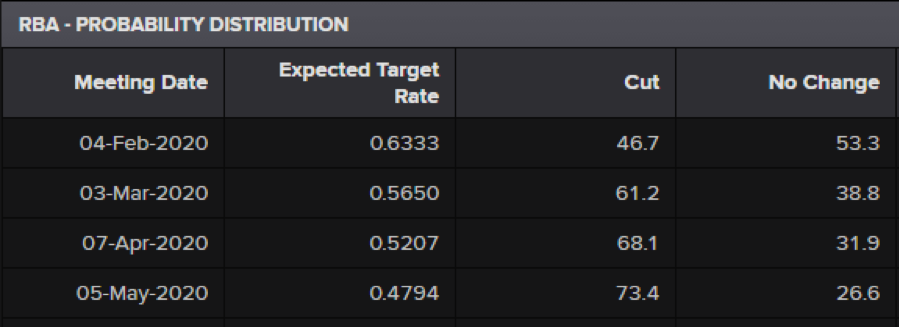
Looking to 2020 and beyond, the first thing to point to is the fact the RBA is expected to cut rates further; once in the first quarter, with the possibility of a second one in the third quarter of 2020.
This will further impact TD holders. It will likely positively impact property and equity investors. The difference between investment return is causing TD and cash holders to leave cash behind and move into these other asset classes.
So, if you are thinking about your investments as we start a new decade, the charts from the past decade show that as the RBA cash rate falls, equity and property will rise, and more and more investors are moving this way.
Click here to view the InvestSMART Capped Fee portfolios.


Frequently Asked Questions about this Article…
Over the past decade, equities and property have been neck and neck in terms of wealth creation on a total return basis. Both asset classes have significantly contributed to investors' portfolios.
The RBA's interest rate cuts, from 4.75% in 2011 to 0.75% currently, have inflated core investment assets like property and equities, making them more attractive to investors.
The RBA's policy stance is considered 'loose' because it is designed to stimulate the economy and create inflation. This approach is the loosest it has been since the peak of the Global Financial Crisis.
Dividends are significant for Australian equity investors because they provide a steady income stream. Despite falling cash rates, the yield from Australian securities remains attractive compared to the rest of the developed world.
Term deposit yields have reached record all-time lows due to the falling cash rate, making them less attractive compared to the yields offered by equities.
The RBA is expected to cut rates further in 2020, once in the first quarter and possibly again in the third quarter. These cuts are likely to positively impact property and equity investors while negatively affecting term deposit holders.
Investors are moving away from cash and term deposits due to the low yields they offer, especially as the RBA cash rate falls. Many are shifting towards equities and property, which have shown better returns.
Investors should consider the trend of falling RBA cash rates, which historically has led to rising equity and property values. This trend suggests a shift in investment strategy towards these asset classes might be beneficial.


