InvestSMART Australian Exchange-Traded Product Quarterly Report - March 2018


About this report
Highlights
Market Overview
Securities Overview
About this report
Welcome to InvestSMART’s March Quarter 2018 Australian Exchange-Traded Products (ETP) update.
Exchange Traded Funds (ETFs) form the basis of a range of InvestSMART’s Separately Managed Account (SMA) portfolios. The purpose of this report is to provide our clients with an easy to digest wrap of market activity as well as provide a greater level of insight into how and why we’ve built our SMA portfolios the way we have.
ETFs are a low-cost, hassle-free way for investors to achieve their investment objectives. Whether your aim is to diversify your portfolio or to obtain exposure to a particular investment theme, the ability to buy ETFs directly on market, their low cost and transparency has seen the popularity of these securities amongst investors grow rapidly.
We have categorised the ETP market by asset class to allow members to quickly identify suitable securities to fill any investment gaps in their portfolio and remain aligned to their specific investment objectives.
Figure 1: Asset Classes
| Asset Class | Description |
|---|---|
| Commodities | Exchange Traded Products (ETPs) that provide exposure to various Commodities & Natural Resources. |
| Currency | Exchange Traded Products (ETPs) that provide exposure to various Currencies. |
| Diversified | Exchange Traded Products (ETPs) that provide Diversified Multi Sector exposure |
| Equities | Exchange Traded Products (ETPs) that provide exposure to Equity Markets. |
| Fixed Income & Cash | Exchange Traded Products (ETPs) that provide exposure to Interest Rate securities and Cash. |
| Property & Infrastructure | Exchange Traded Products (ETPs) that provide exposure to Domestic and Global Property and Infrastructure. |
About InvestSMART
Founded in 1999, InvestSMART Group Limited (ASX:INV) believes everyone should have the confidence to control their financial future and it shouldn’t be hard or expensive to do so.
Whether you’re managing your own investments or looking for a little help, we deliver straightforward, flexible and affordable solutions to ensure you are better able to meet your investment goals.
Our three leading brands – InvestSMART, Eureka Report and Intelligent Investor – together offer actionable investment tools, wealth advice and independent ASX-listed stock research.
We’re all about making investing simple. Statistics show four in five Australians do not receive any professional investment advice, with cost the primary reason. We aim to change that.
Through our Portfolio Manager, stock research, wealth commentary and affordable investment products, we believe we are delivering the right tools to help all Australians grow and protect their wealth.
InvestSMART Star Rating
When reviewing an ETF there are some key quantifiable metrics common to every security.
To save time in reviewing each and every ETF listed on the Australian Market, we have developed a Quantitative 5 Star Rating System that takes each of these items into account. It is reflective of the process we use to identify investments for our own SMA portfolios.
Figure 2: InvestSMART Star Rating Criteria
| Factor | Description |
|---|---|
| Size | Funds under management. |
| Fees | Fund management fees as a percentage of FUM. |
| Liquidity | Trading volumes. |
| Spread | The average percentage difference between the bid & ask. |
| Tracking error | The difference in the return profile of the Fund to its benchmark. |
For our portfolios, we generally like to see a 4 to 5-star rating, as this implies the security rates well across each of the above-mentioned metrics. However, the star rating is best used as a filtering tool when comparing ETFs with the same objective. It does not make sense to compare a highly liquid, and hence low-cost S&P500 ETF to one designed to track the performance of emerging markets which are often less liquid and more expensive to access.
It should also be noted that the InvestSMART Star Rating is a quantitative measure and it does not take one’s investment objectives into account. The InvestSMART Star ratings do not constitute recommendations. Additionally, we do not rate Actively Managed Funds or Structured products, and this is denoted by an NR or “Not Rated”.
Figure 3: Number of ETFs per star rating
| Star Rating | Number of ETFs |
|---|---|
 5 5 |
7 |
| 4 |
31 |
| 3 |
58 |
| 2 |
42 |
| 1 |
4 |
| NA | 34 |
Changes this Quarter
We encourage feedback from our members as it allows us to continually build more useful products. Following suggestions, this quarter we’ve made some changes to the report. These include:
- Clearer distinctions between Active & Passive Funds
- Greater level of detail in breaking down asset classes
Let us know what else you’d like to see in our quarterly report. Contact us
with the InvestSMART Portfolio Manager
An ASIC framework for defining Active vs Passive funds
Exchange Traded Products are those that include portfolio exposure securities that trade intra-day on an exchange. Broadly speaking, they can be categorised under two headers in reference to the portfolios management style, as either ‘active’ or ‘passive’.
As the market for listed funds continues to grow, ASIC has sought to clarify the naming conventions in its Information Sheet 230: Exchange traded products .
In simple terms, a passive fund seeks to replicate or track the performance of an index, specified combination of multiple indices, or other widely regarded benchmark, the value of which is continuously disclosed, or can be immediately determined .
An active fund is one that buy or sells investments based on an active investment strategy or where they seek to outperform a particular benchmark .
Figure 4: Categorisation of Exchange Traded Products (ETPs)
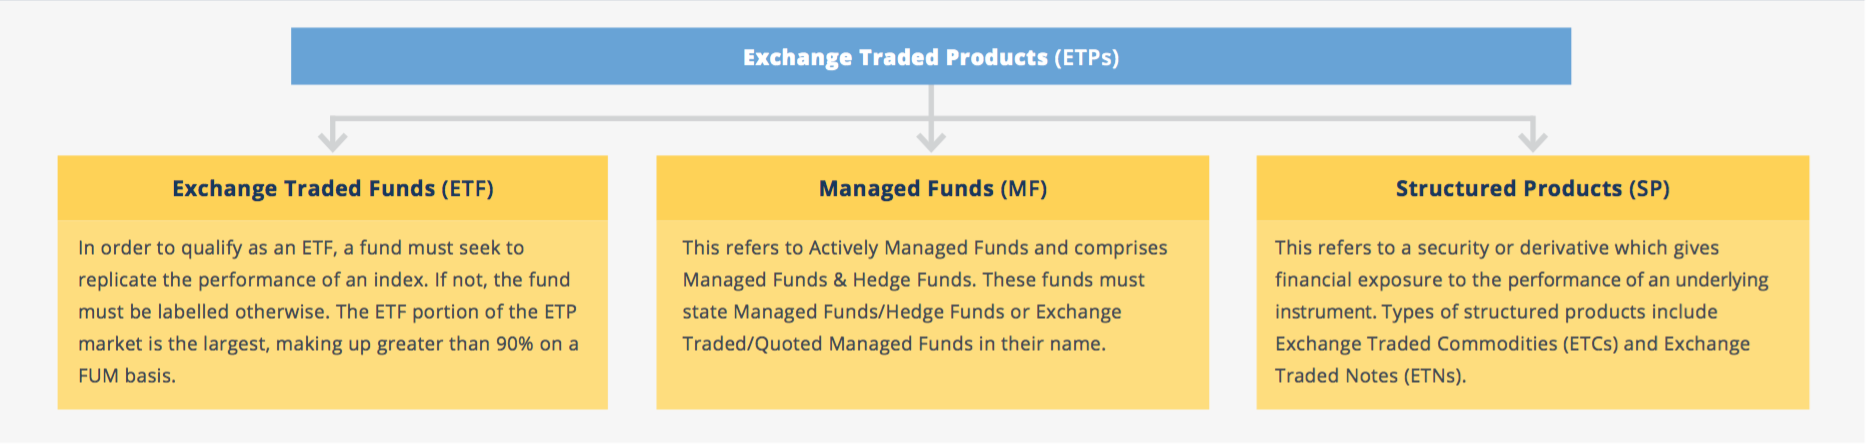
A grey area exists for Smart Beta products as they are somewhat of a Hybrid between active and passive management. So long as they seek to replicate or track the performance of an index, they can be referred to as an ETF.
As each type of product comes with varying levels of risk, we will adopt these conventions when referring to securities throughout our report to provide greater clarity to readers.
ETF Due Diligence
The Domestic ETF market is still quite small when we consider global exchanges, and the variety of options currently on offer is quite concentrated in regard to exposure. However, as the market matures, and more funds are listed, investors will need to be able to identify the differences between two similar ETFs.
This month we dive deeper into the due diligence process and provide a framework for identifying the differences between across ETFs.
Note, this framework is applicable to analysing ETFs, that is passively managed funds that seek to track the performance of a given index and does not necessarily apply to actively managed products which generally require greater understanding of the portfolio manager, investment philosophy, track record etc.
Exposure
“Does the fund deliver the desired exposure”
After identifying the gaps in your current portfolio, the next step is to identify securities designed to provide exposure to them.
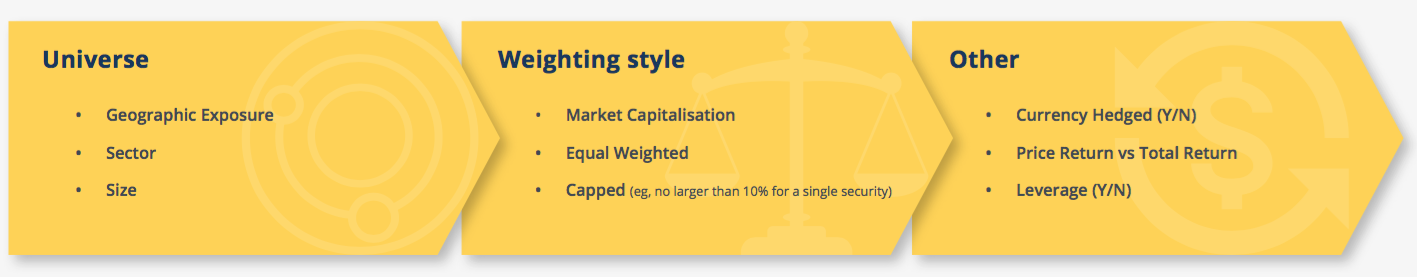
ETFs are designed to track indices, so the quickest way to determine the exposure that an ETF will provide you is to understand its benchmark. Most ETFs will provide a rundown of the benchmark construction methodology within their PDS documentation and some key items to consider include:
Figure 5: Benchmark construction methodologies
Performance
“Evaluation of the ETFs performance”
Unlike an actively managed fund that is designed to provide returns in excess of their stated benchmark, ETFs are managed to track their chosen benchmark index. A well-managed ETF should track closely and how well the ETF tracks its benchmark can be monitored by two metrics.
The difference in returns of ETF to its Benchmark for a given period is referred to as the tracking difference. The tracking error refers to the volatility of the tracking difference and a lower tracking error suggests greater consistency in the difference.
You cannot invest in a benchmark index, that is why ETFs exist. However, doing so incurs costs and some reasons as to why an ETFs performance vary to its benchmark include:
- Management fee
- Tax
- Transactional/rebalancing costs
- Securities lending
- Poor management
The lower the tracking difference and error the better when comparing two similar ETFs.
Structure
“How is the fund constructed”
Dependant on the underlying asset which the ETF is designed to track, the issuer can elect to construct the ETF in a variety of ways. The reasons as to why the issuer may choose to construct a fund in a certain way may come down to cost, liquidity, number of benchmark constituents & holding practicality.
| Physical | Synthetic |
|---|---|
| If an ETF has a physical construction methodology it physically holds the underlying securities. | These ETFs use derivatives as a means of delivering returns in line with a given index and open an investor up to a range of risks that a physical ETF do not, for example counterparty risk. |
| Those funds that hold all the underlying securities are said to be fully replicating, while those that do not are classed as optimised or partially replicating. Some indices may comprise 000’s of securities and replicating them in full can prove costly. | The most common reason an issuer may elect to construct a fund in this way is that physically holding the underlying security is impractible, in the case of many commodity ETFs. |
| An optimised or partially replicating ETF seeks to find the sweet spot between maintaining a low tracking error without incurring unnecessary transactional costs. |
Domicile
“Where is the fund domiciled, and how does that effect the investor”
A number of Internationally focused ETFs are domiciled overseas or “cross-listed” meaning that for tax purposes they are not ‘Australian Residents’.
For a cross listed ETF, the administrative burden at tax time is passed on to the investor. That is, each investor needs to fill out a W8-BEN form to be eligible for reduction in US withholding taxes from 30 to 15%. For an Australian Domiciled ETF investing in overseas securities, this only needs to be done once by the manager for the benefit of all investors.
There are two quick ways to determine if an ETF is cross listed:
- Instead of a PDS, the ETF is issued with a Prospectus
- The ASX refers to Internationally Domiciled securities as a “Chess-Depository-Interest” or CDI’s
When reviewing an ETF, you should identify where it is domiciled and understand the potential tax implications for you, and the effect this may have on the funds’ performance.
Liquidity
“Will I be able to buy or sell when I need to”
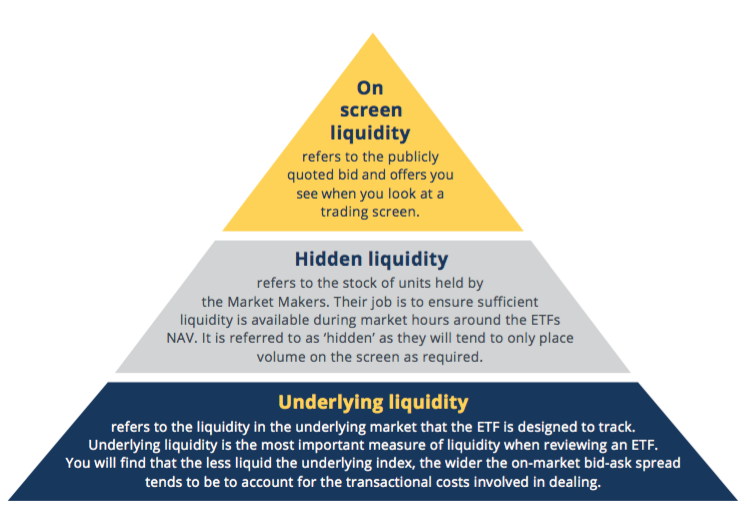
A common concern investors’ have when reviewing an ETF is liquidity, or the ability to buy or sell when required. Unlike trading in equities, there are three levels to an ETFs liquidity.
Figure 7: The three levels of ETF liquidity
Understanding underlying liquidity
As an example, SPDRs S&P/ASX 200 Fund is designed the track the S&P ASX 200. If SPDR needed to satisfy demand for a large order in excess of current units on screen and held by the market makers, a market maker would simply buy the constituent securities of the ETF on market and deliver them to SPDR. SPDR as issuer would then create new units and issue them to the Market Maker who would place them on market hence providing liquidity. This is a benefit of the open-ended structure of ETFs and the reason why price will track the funds NAV for the majority of the time.
Costs
“What is the total cost of ownership”
The cost of an ETF is more than just its quoted management fee.
The other cost to consider when reviewing an ETF is the bid-offer spread. ETFs are designed to closely track the NAV of the underlying portfolio and this is done through the use of market makers. Market makers will place bids and offers either side of the NAV at a margin or “spread”.
This spread is designed to account for the transaction costs incurred in buying or selling the underlying portfolio constituents to account for money entering or exiting the fund so as not to disadvantage existing unit holders.
Generally, the less liquid the underlying securities in the ETF, the wider the spread will be. Other costs (or benefits) involved in running an ETF, such as rebalancing costs, taxes and securities lending revenue will be accounted for in the tracking difference.
Market Overview - Key Highlights

 |
 |
 |
Market Overview - FUM
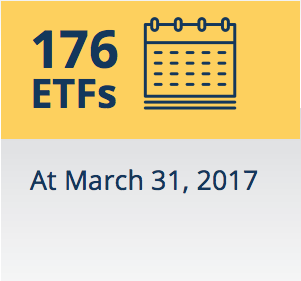
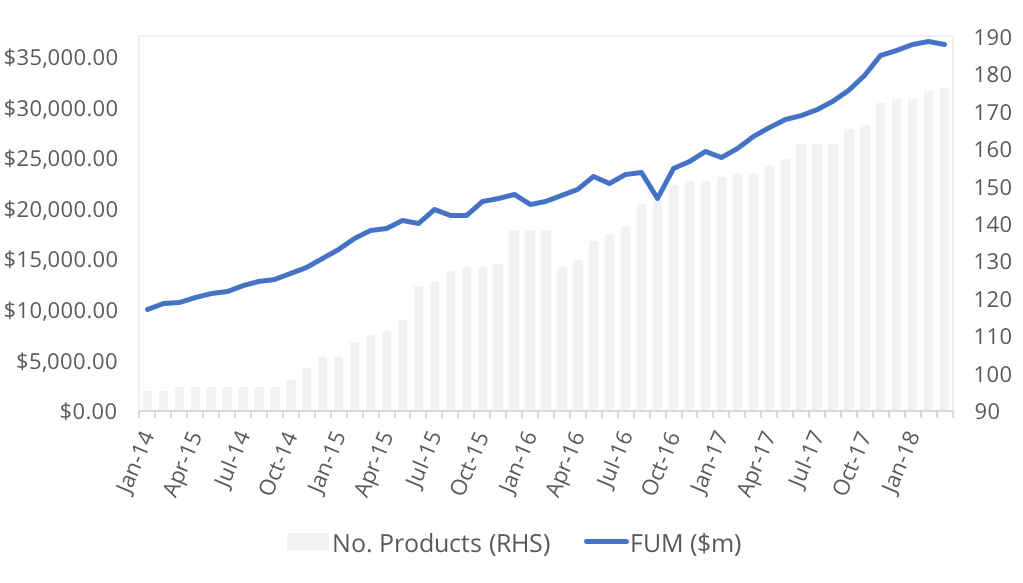
The Australian ETP market has grown to $36bn as at March 2018. This is despite March posting the first negative month for FUM growth in 13 months. While net inflows were positive, negative equity market performance saw total FUM decline slightly.
| Figure 8: Market Growth | Figure 9: % FUM Growth: Inflows vs Performance |
|---|---|
 |
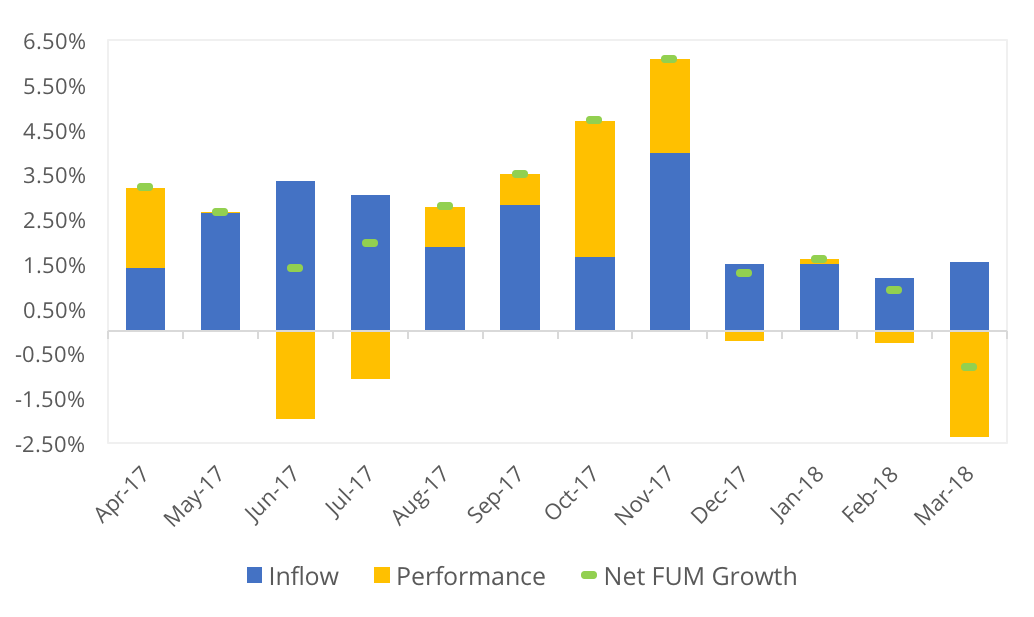 |
Source: ASX
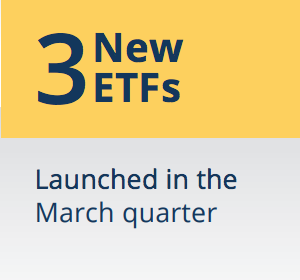
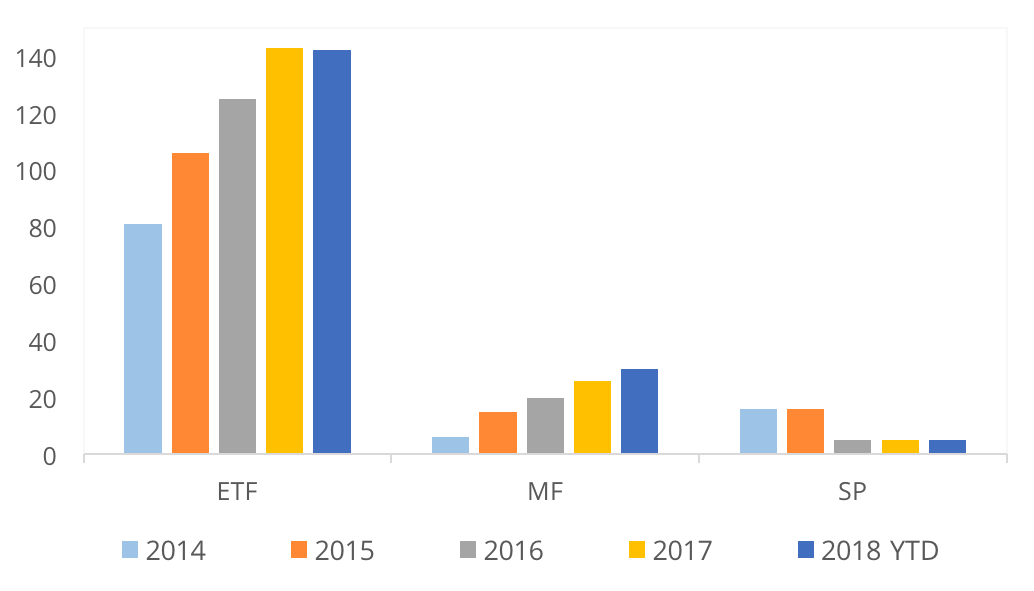
During the period BetaShares launched two new funds while VanEck issued one. This has taken the number of ETPs listed on the ASX to 176, up from 173 in December 2017.
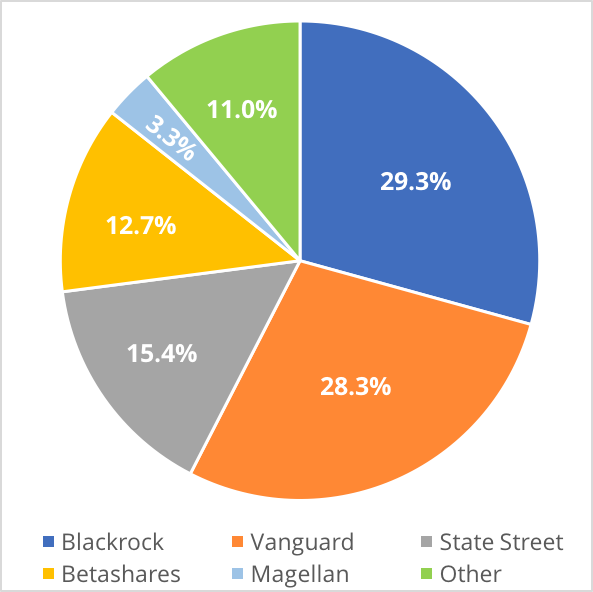
Figure 10: ETP Market breakdown by issuer.
| Issuer | No. Funds (Dec) | No. Funds (Mar) | FUM $m (Dec) | FUM $m (Mar) | Market Share |
|---|---|---|---|---|---|
| Blackrock | 39 | 39 | $10,431.83 | $10,593.62 | 29.29% |
| Vanguard | 22 | 22 | $10,077.28 | $10,229.50 | 28.28% |
| State Street | 16 | 16 | $5,691.77 | $5,556.27 | 15.36% |
| Betashares | 42 | 44 | $4,527.69 | $4,591.57 | 12.69% |
| Magellan | 3 | 3 | $1,189.27 | $1,211.39 | 3.35% |
| VanEck | 10 | 11 | $969.78 | $1,132.03 | 3.13% |
| Russell | 6 | 6 | $647.82 | $641.83 | 1.77% |
| ETFS Securities | 15 | 15 | $889.28 | $974.70 | 2.69% |
| Market Vectors | 4 | 4 | $445.87 | $469.53 | 1.30% |
| UBS | 9 | 9 | $272.19 | $269.67 | 0.77% |
| Platinum | 2 | 2 | $194.76 | $275.15 | 0.76% |
| Switzer | 1 | 1 | $77.67 | $75.60 | 0.21% |
| Montgomery | 1 | 1 | $62.58 | $71.78 | 0.20% |
| Schroder | 1 | 1 | $45.25 | $45.53 | 0.13% |
| K2 Asset Management | 2 | 2 | $36.89 | $33.28 | 0.09% |
| 173 | 176 | $35,559.93 | $36,171.46 | 100.00% |
Source: ASX and Morningstar
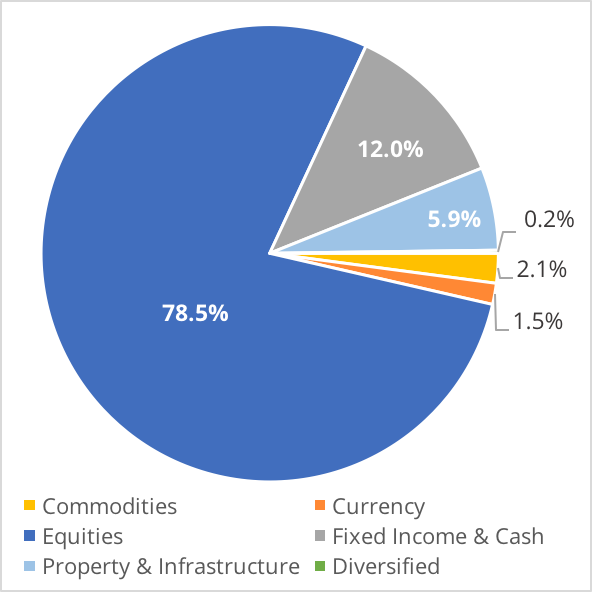
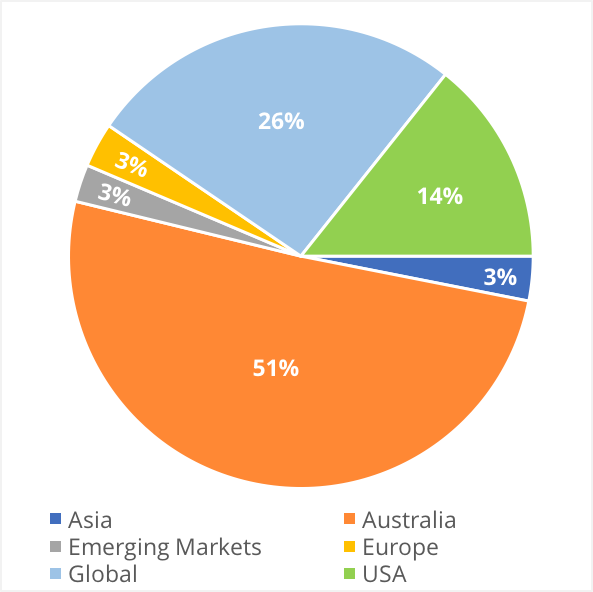
Figure 11: Australian ETF market breakdown
| Asset Class | Geography | Issuer |
|---|---|---|
| The largest asset class in terms of both product range as well as FUM is equities, representing over 75% of the market. | Geographically, the largest exposure for ETFs across the market is Australia, followed by those providing diversified global exposure. | With combined FUM over $30 billion, close to 90% of the Australian ETFs market is managed by five issuers, namely BlackRock, Vanguard, State Street, BetaShares and Magellan. |
 |
 |
 |
Source: ASX and Morningstar
Two new actively managed funds from BetaShares were listed this quarter as well as a sustainable equity ETF from VanEck.
Figure 12: New ETP listings
| Security | Fund | Asset Class | Focus |
|---|---|---|---|
| EINC | BetaShares Legg Mason Equity Income Fund | Equities | Actively-managed diversified portfolio of income-oriented Australian shares |
| RINC | BetaShares Legg Mason Real Income Fund | Property & Infrastructure | Actively-managed diversified portfolio of ASX-listed securitiees holding real or "hard" physical assets. |
| ESGI | VanEck Vectors MSCI Intl Sust Eq ETF | Equities | Diversified portfolio of sustainable international companies listed on exchanges in developed markets. |
Source: ASX and Morningstar
Figure 13: Product Breakdown by structure
Market Overview - Flows
Fund flow is an interesting metric when analysing the ETP market as it provides insight to investor sentiment. Given the majority of ETPs are index tracking, that is they are designed to replicate the performance of a given market index or asset class, analysing flows gives an insight into trends in market sentiment toward a given asset class or thematic.
Overview
Figure 14: Quarterly Flows
Source: ASX
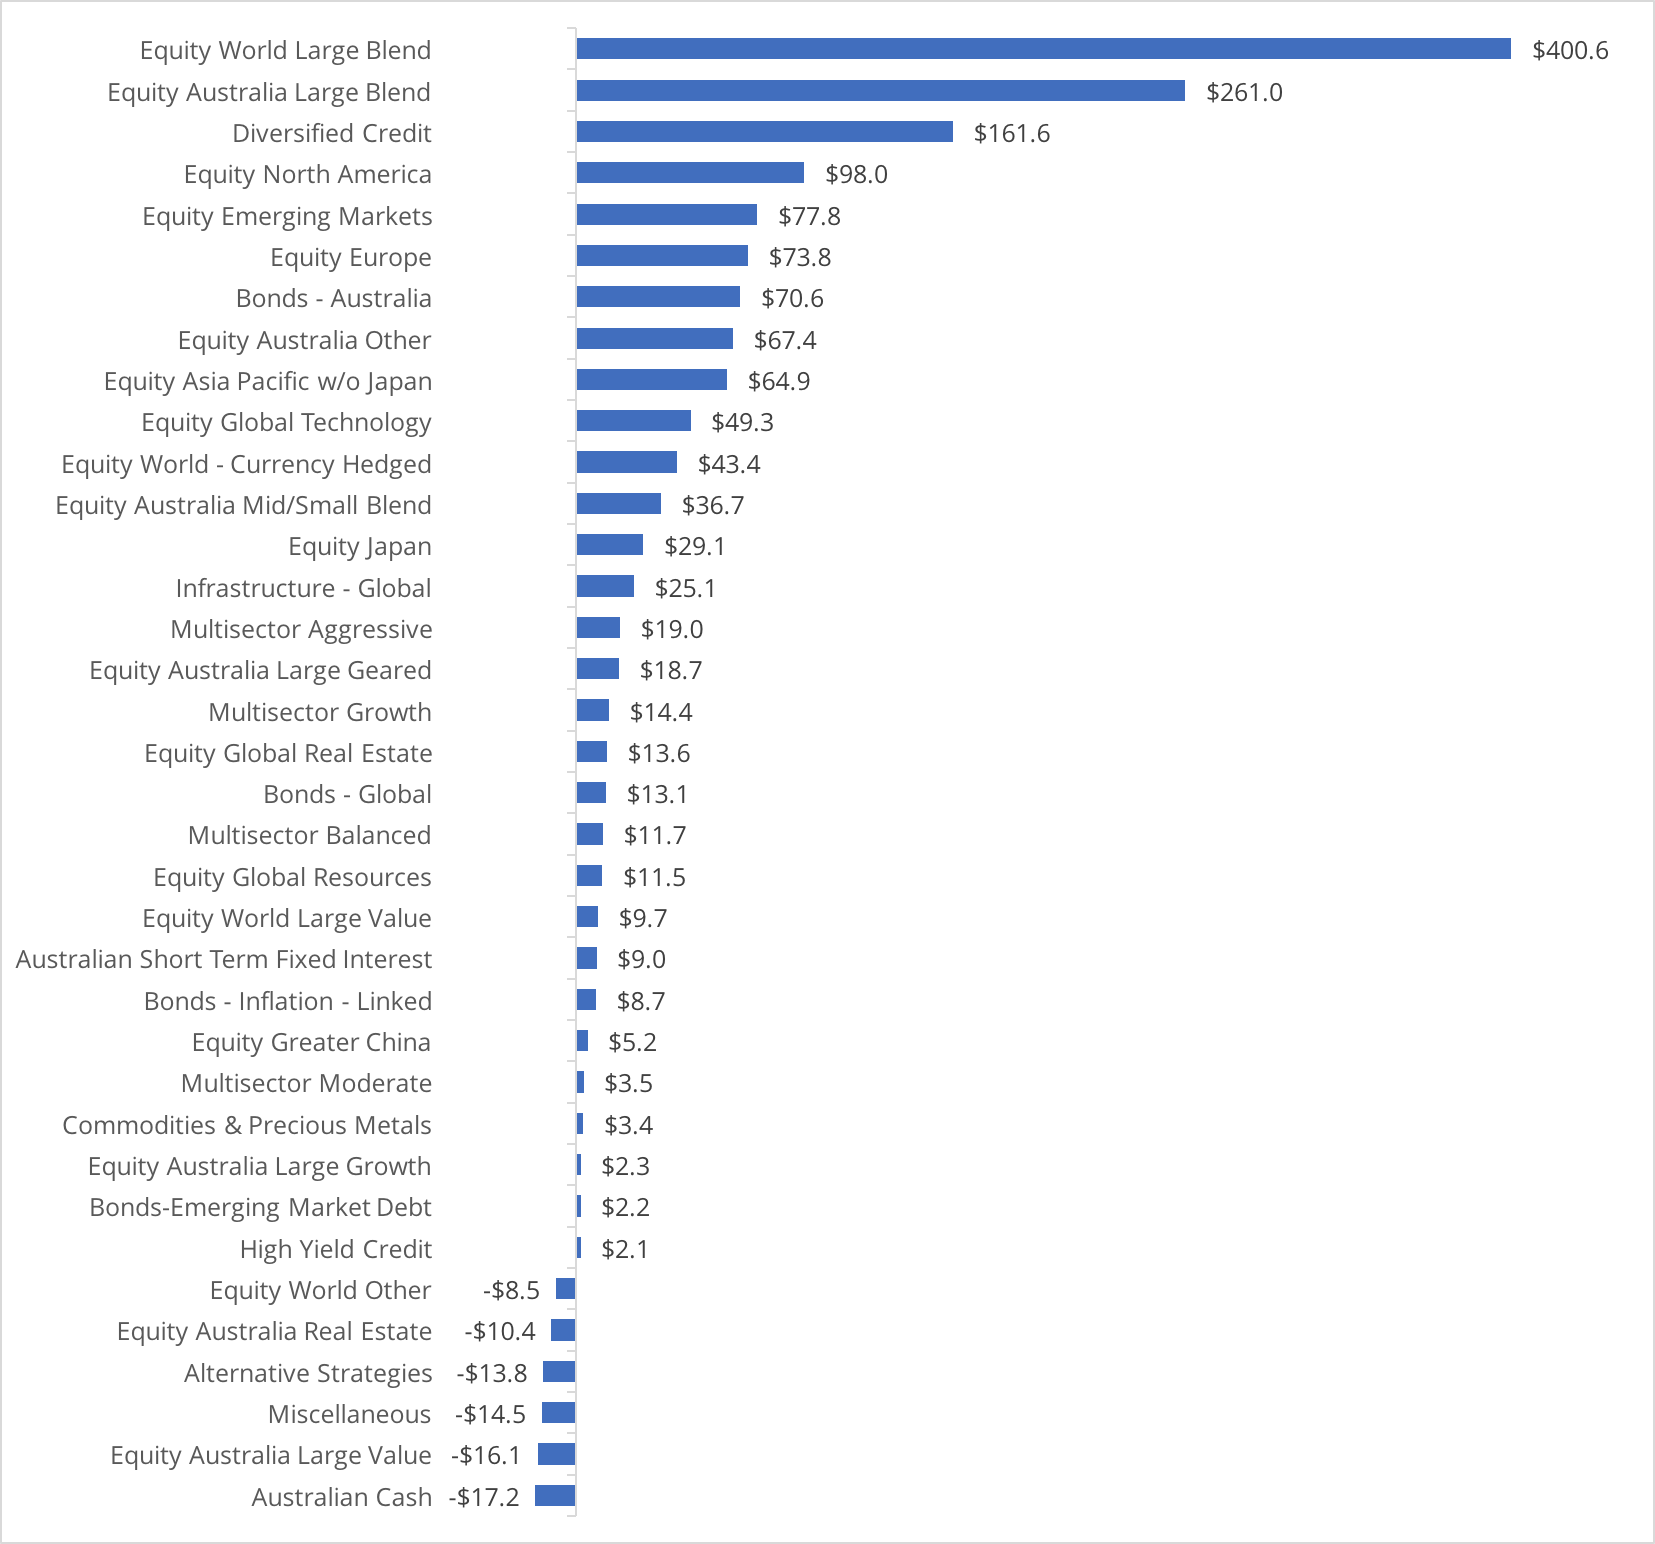
Global and Domestic large cap equity products saw the majority of inflows for the March Quarter and The Vanguard MSCI Index International ETF (VGS) saw the largest inflows for the quarter, at $120.7m. At a security level domestic property, as represented by the Vanguard Australian Property Securities Index ETF (VAP) saw the largest outflows due to poor performance in the sector.
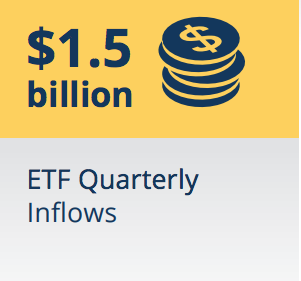
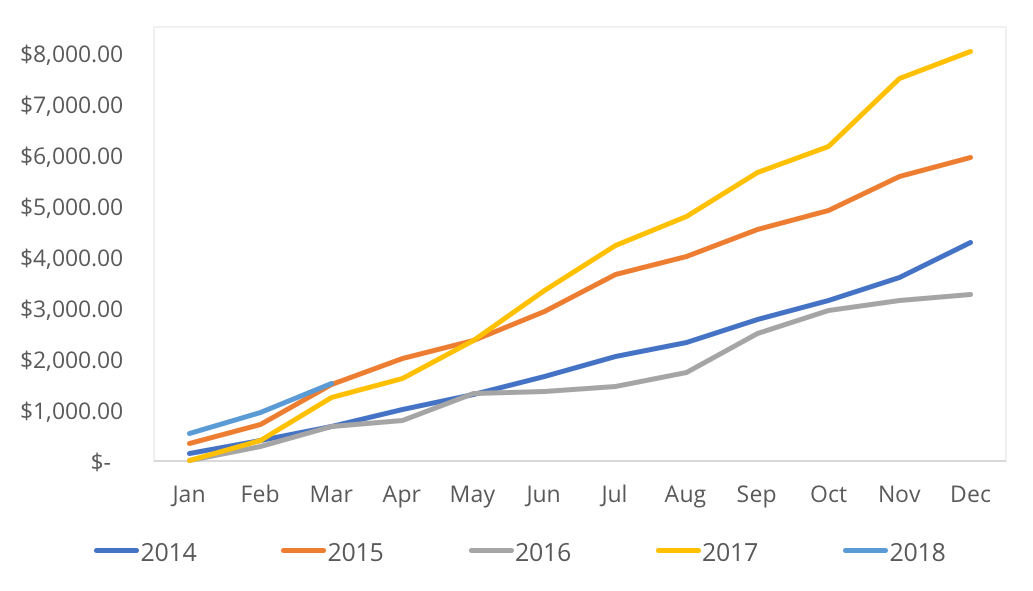
In dollar terms, cumulative inflows to date currently exceed those seen at this point last year.
Figure 15 & 16
| Cumulative FUM Flows ($m) | FUM Flows ($m) by Asset Class |
|---|---|
 |
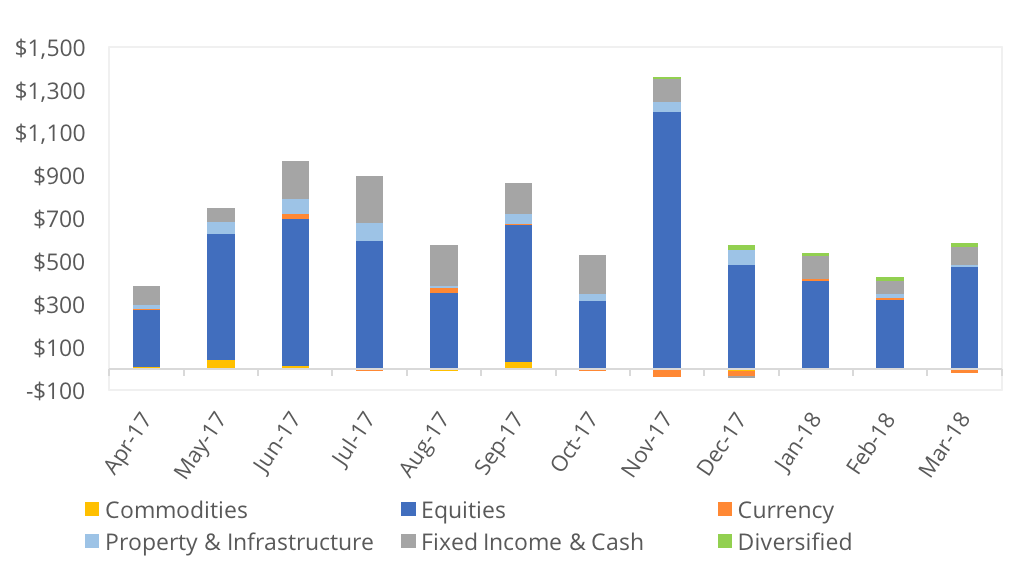 |
Source: ASX and Morningstar
Figure 17: Largest Inflows (Qtr)
| ETF | Flows ($m) | Sub Category |
|---|---|---|
| [VGS] Vanguard MSCI Index Intl ETF | 120.71 | Equity World Large Blend |
| [STW] SPDR? S&P/ASX 200 ETF | 95.43 | Equity Australia Large Blend |
| [VEU] Venguard All-World ex-US Shares ETF | 88.69 | Equity World Large Blend |
| [PIXX] Platinum International {Quoted Mngd Hdg} | 60.55 | Equity World Large Blend |
| [VHY] Vanguard Australian Shares High Yld ETF | 57.74 | Equity Australia Large Blend |
Source: ASX and Morningstar
Figure 18: Largest Outflows (Qtr)
| ETF | Qtr Flows ($m) | Sub Category |
|---|---|---|
| [VAP] Vanguard Australian Property Secs ETF | -47.50 | Equity Australia Real Estate |
| [QOZ] BetaShares FTSE RAFI Australia 200 ETF | -41.91 | Equity Australia Large Blend |
| [HVST] BetaShares Australian Div Harvester (mgd) | -41.12 | Equity Australia Large Value |
| [AAA] BetaShares Aus High Interest Cash ETF | -23.24 | Australian Cash |
| [QFN] BetaShares S&P/ASX200 Fincls Sect ETF | -18.35 | Equity Australia Other |
Source: ASX and Morningstar
Market Overview - Performance
An ETF should closely track its underlying index. Unlike active fund mandates, negative returns do not necessarily mean the fund manager is doing a bad job, but rather reflects the performance of the underlying securities the ETF has been designed to track.
When reviewing an actively managed fund though, cost vs long term performance is an important metric to consider.
Overview
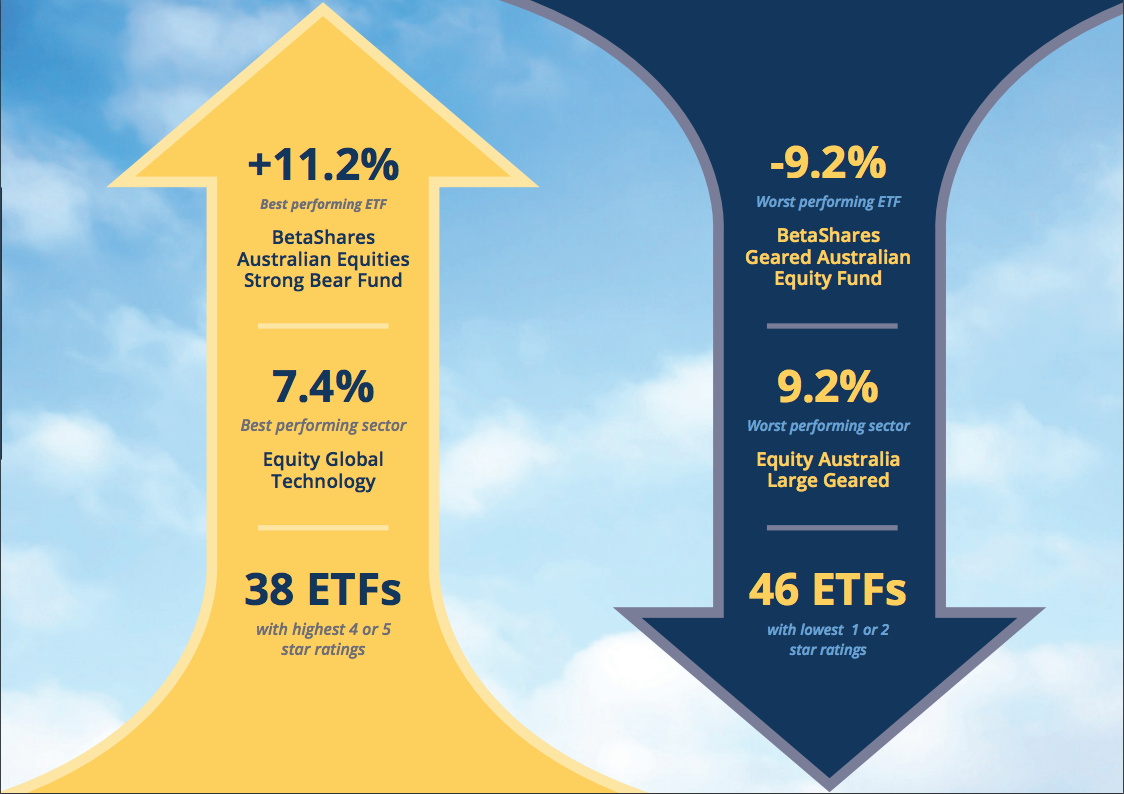
For the March quarter, global tech saw the best returns on average, while geared Australian equity saw standout negative returns. For the 12 months to date, Asian equities were the standout sector with ETPs exposed to the region returning in excess of 20%.
Figure 19 & 20: 3 & 12 month performance
| 3 Month Returns |
|---|
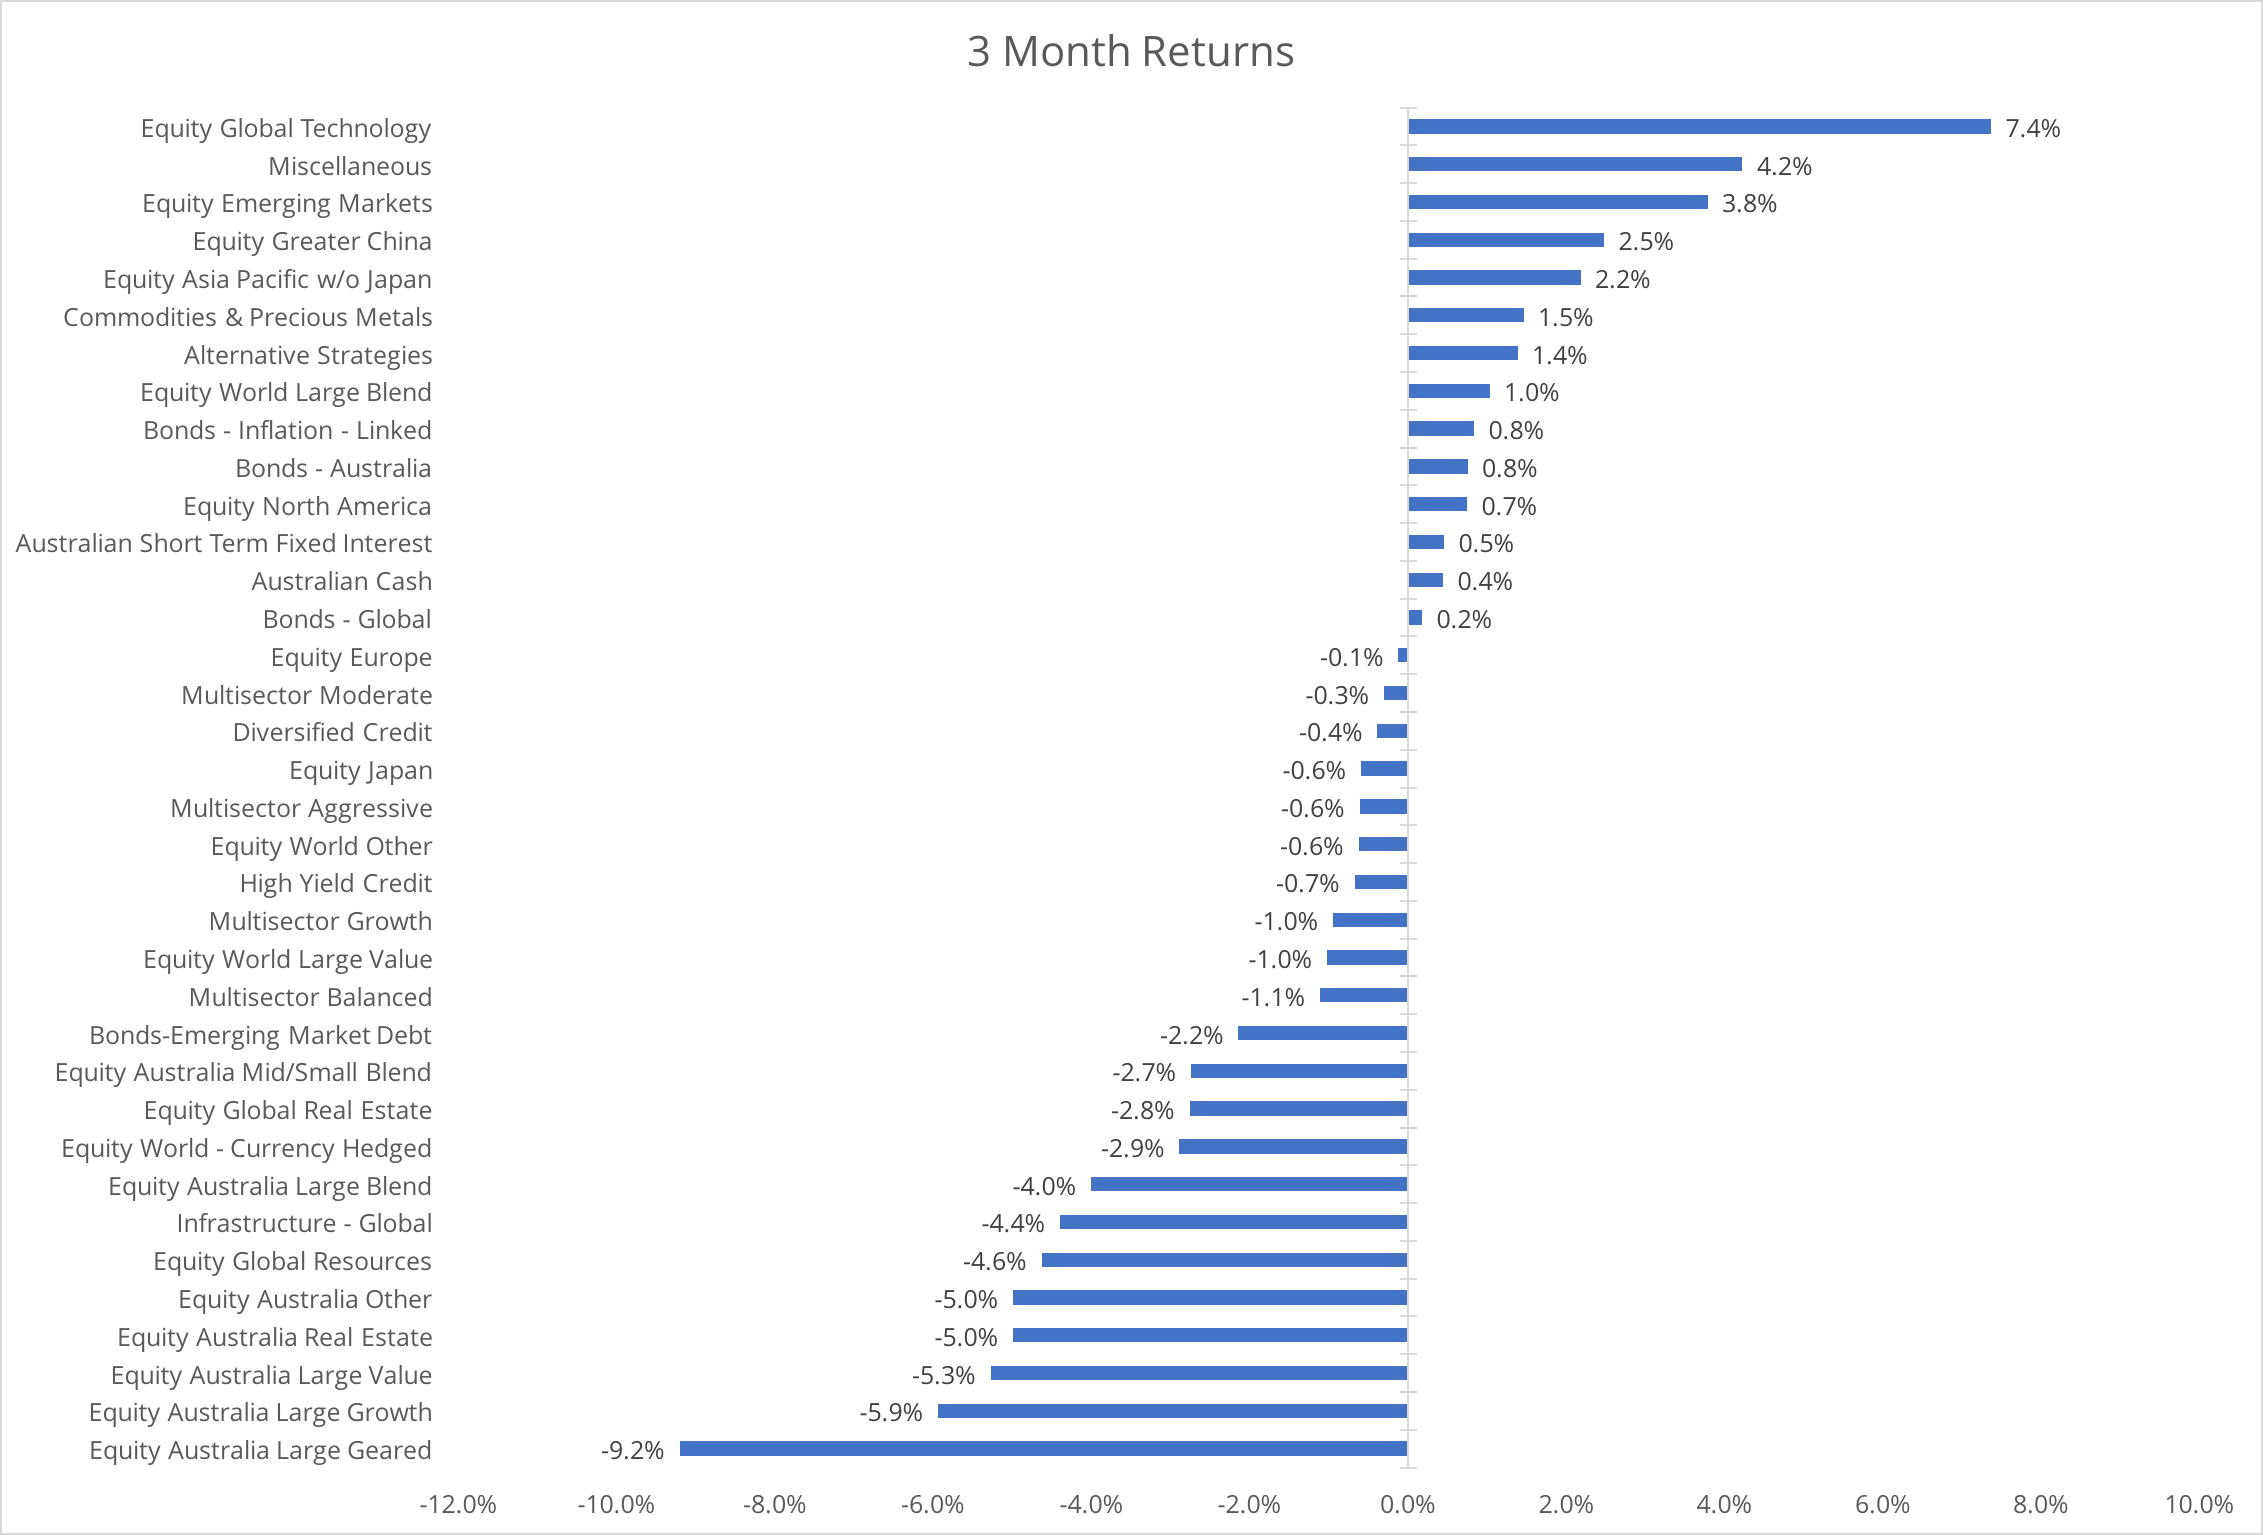 |
| 12 Month Returns |
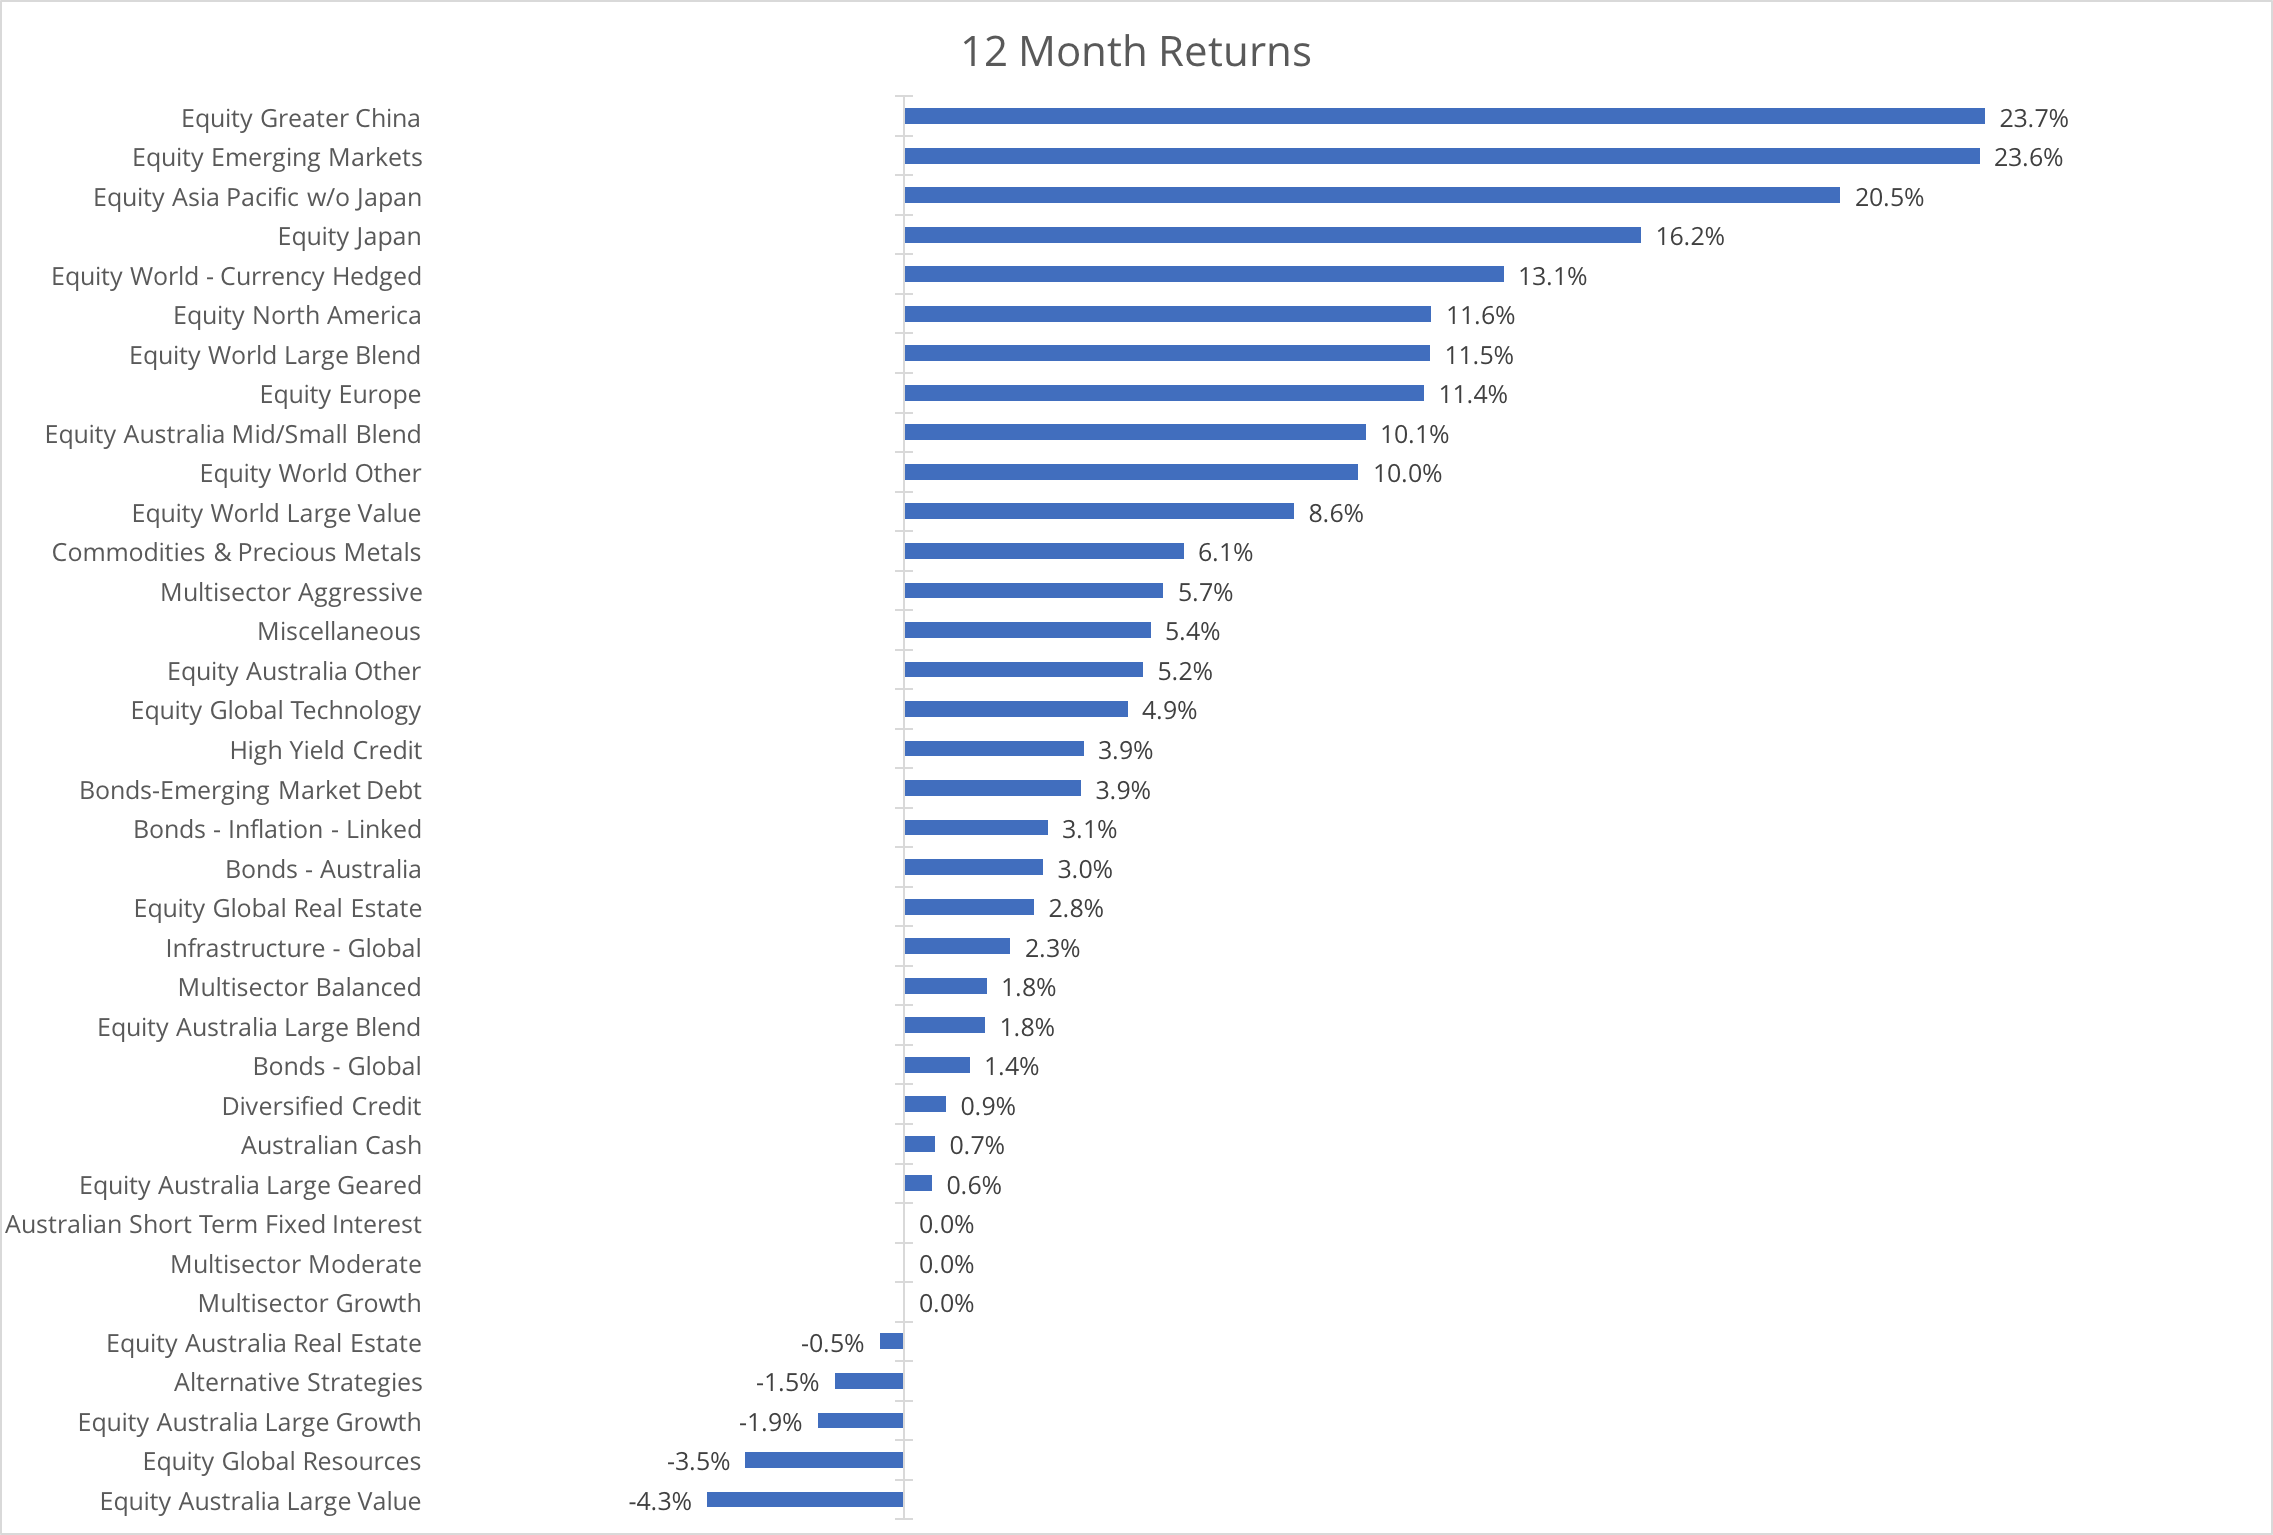 |
Source: Morningstar
Figure 21: Top 5 performing securities
| ETF | 3 Mnth Return | Sub Category |
|---|---|---|
| [BBOZ] BetaShares Australian Eqs Strong BearHdg | 11.24% | Alternative Strategies |
| [HACK] BetaShares Global Cybersecurity ETF | 10.49% | Equity Global Technology |
| [TECH] ETFS Morningstar Global Technology ETF | 8.91% | Equity Global Technology |
| [OOO] BetaShares Crude Oil ETF Ccy Hdg (Synth) | 8.02% | Commodities & Precious Metals |
| [ITW] iShares MSCI Taiwan ETF | 6.50% | Equity World Other |
Source: Morningstar
Figure 22: Worst 5 performing securities
| ETF | 3 Mnth Return | Sub Category |
|---|---|---|
| [GEAR] BetaShares Geared Australian Equity (Hdg) | -9.21% | Equity Australia Large Geared |
| [RVL] Russell Inv Australian Value ETF | -8.83% | Equity Australia Large Value |
| [MVA] VanEck Vectors Australian Property ETF | -7.27% | Equity Australia Real Estate |
| [DIV] UBS IQ Morningstar Australia Div Yld ETF | -6.98% | Equity Australia Large Growth |
| [RDV] Russell Inv High Dividend Aus Shrs ETF | -6.89% | Equity Australia Large Value |
Source: Morningstar
Securities Overview - Commodities
Focus: Securities designed to provide exposure to the performance of various commodities and natural resources.
We do not hold any Commodity focused ETFs in our SMA Portfolios.
| Commodities | FUM ($m) | Qtr Flows ($m) | No. of Funds |
|---|---|---|---|
| $ 759.00 | $ 4.30 | 10 |
Source: ASX and Morningstar
Overview
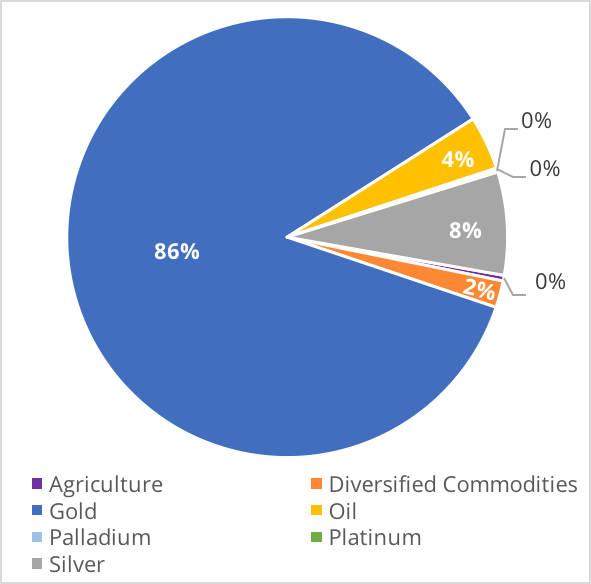
Despite strong returns, BetaShares Crude Oil ETF (OOO) was the one ETP to see net outflows this quarter and in a reverse to the December quarter, BetaShares Currency Hedged Gold Bullion ETF (QAU) saw the highest net inflows for the sector. This is likely due to protectionist policy, US-China trade tensions and a run on in bond markets as inflation increased.
| Figure 23: Funds Under Management ($m) | Figure 24: Geographic Exposure |
|---|---|
 |
 |
| Figure 25: Flows ($m) | Figure 26: Average Cost |
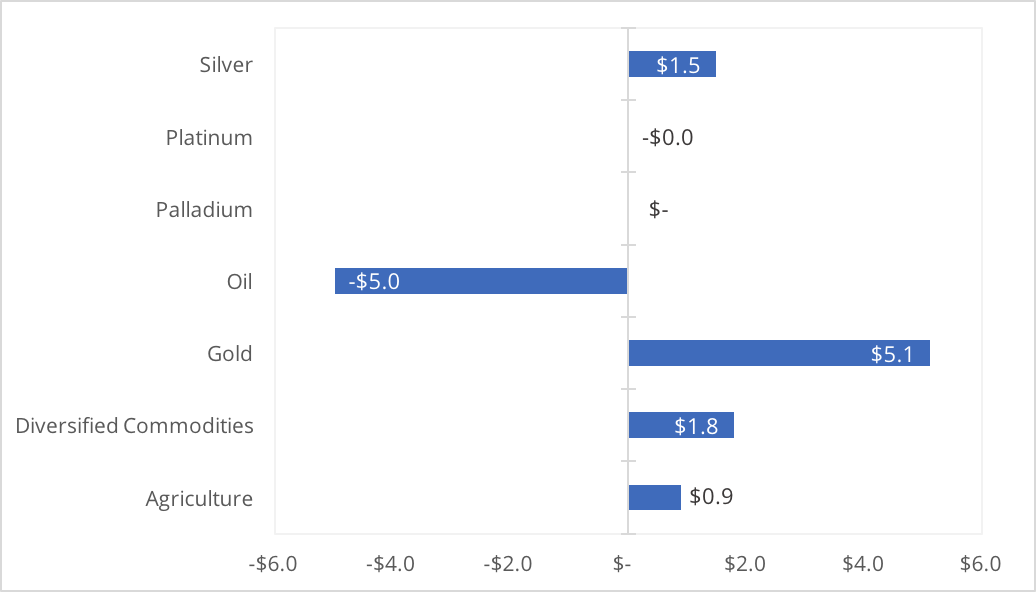 |
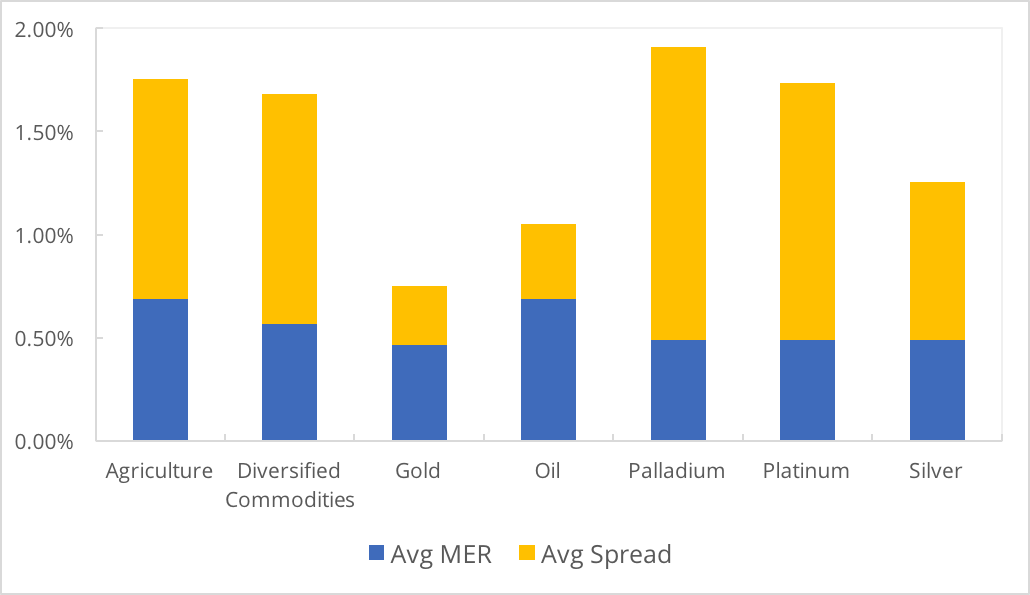 |
| Figure 27: Average Performance | |
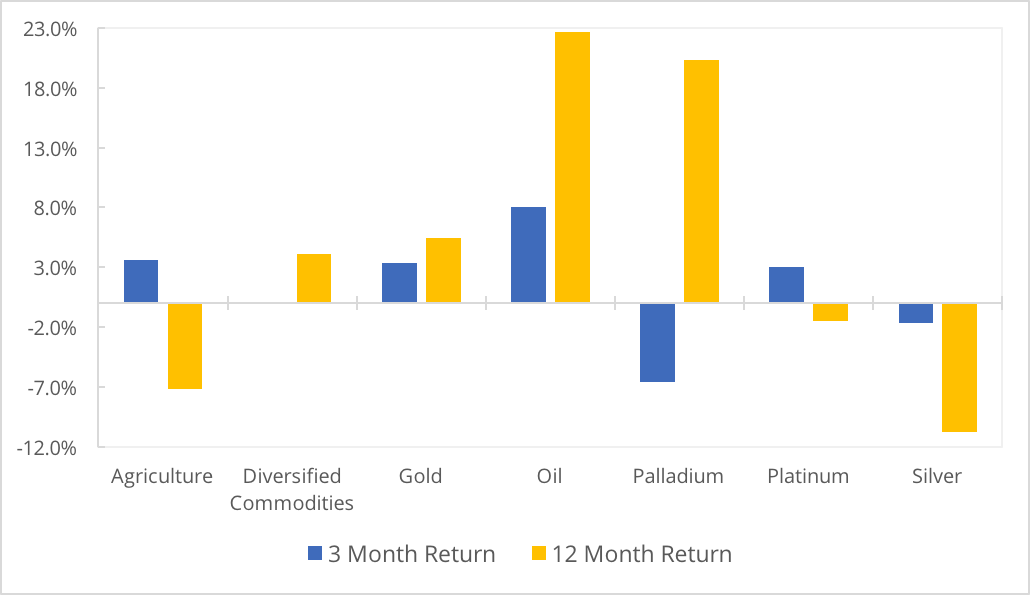 |
Source: ASX and Morningstar
Key Data: Commodity ETFs
Figure 28: Commodity ETFs
| Name | Total FUM ($M) | Qtr Flows ($M) | MER | Avg Spread | Avg Liquidity | 3MTH Return | 12MTH Return | Yield | Frequency | Structure | Sub Category | STAR Rating | |
|---|---|---|---|---|---|---|---|---|---|---|---|---|---|
| GLOBAL | |||||||||||||
| Agriculture | |||||||||||||
| [QAG] BetaShares Agriculture ETF CcyHgd(Synth) | 3.17 | 0.90 | 0.69% | 1.06% | 15.24% | 3.57% | -7.15% | 0.00% | Annual | ETF | Miscellaneous | 1 |
|
| Diversified Commodities | |||||||||||||
| [ETPMPM] ETFS Physical PM Basket ETC | 5.04 | 0.00 | 0.44% | 1.33% | 0.80% | 0.86% | 3.55% | 0.00% | Semi-Annual | SP | Commodities & Precious Metals | NR |
|
| [QCB] BetaShares Com Basket ETF Ccy Hgd(Synth) | 9.86 | 1.79 | 0.69% | 0.90% | 15.61% | -0.79% | 4.62% | 0.00% | Annual | ETF | Commodities & Precious Metals | 1 |
|
| Gold. | |||||||||||||
| [GOLD] ETFS Physical Gold ETC | 582.55 | 0.00 | 0.40% | 0.16% | 3.28% | 4.46% | 5.34% | 0.00% | Semi-Annual | Share | Commodities & Precious Metals | NR |
|
| [QAU] BetaShares Gold Bullion ETF Ccy Hedged | 55.29 | 5.12 | 0.59% | 0.42% | 8.84% | 1.71% | 5.27% | 0.00% | Annual | ETF | Commodities & Precious Metals | 2 |
|
| [ZGOL] ETFS Physical Singapore Gold ETF | 13.78 | 0.00 | 0.40% | 0.29% | 4.26% | 4.02% | 5.61% | 0.00% | Annual | ETF | Commodities & Precious Metals | 2 |
|
| Oil | |||||||||||||
| [OOO] BetaShares Crude Oil ETF Ccy Hgd(Synth) | 29.91 | -4.99 | 0.69% | 0.36% | 14.27% | 8.02% | 22.67% | 0.00% | Annual | ETF | Commodities & Precious Metals | 2 |
|
| Palladium | |||||||||||||
| [ETPMPD] ETFS Physical Palladium ETC | 1.07 | 0.00 | 0.49% | 1.42% | 7.18% | -6.54% | 20.30% | 0.00% | Quarterly | SP | Commodities & Precious Metals | NR |
|
| Platinum | |||||||||||||
| [ETPMPT] ETFS Physical Platinum ETC | 1.20 | 0.00 | 0.49% | 1.25% | 4.67% | 3.06% | -1.45% | 0.00% | Quarterly | SP | Commodities & Precious Metals | NR |
|
| Silver | |||||||||||||
| [ETPMAG] ETFS Physical Silver ETC | 57.33 | 1.48 | 0.49% | 0.77% | 3.35% | -1.69% | -10.79% | 0.00% | Semi-Annual | SP | Commodities & Precious Metals | NR |
|
Source: ASX and Morningstar
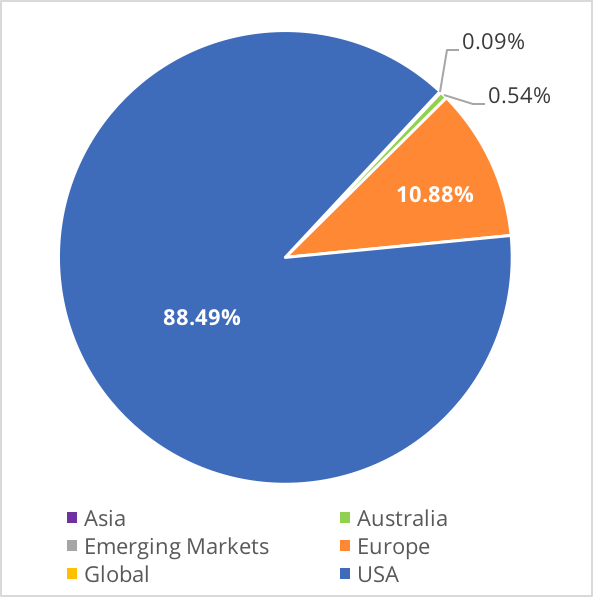
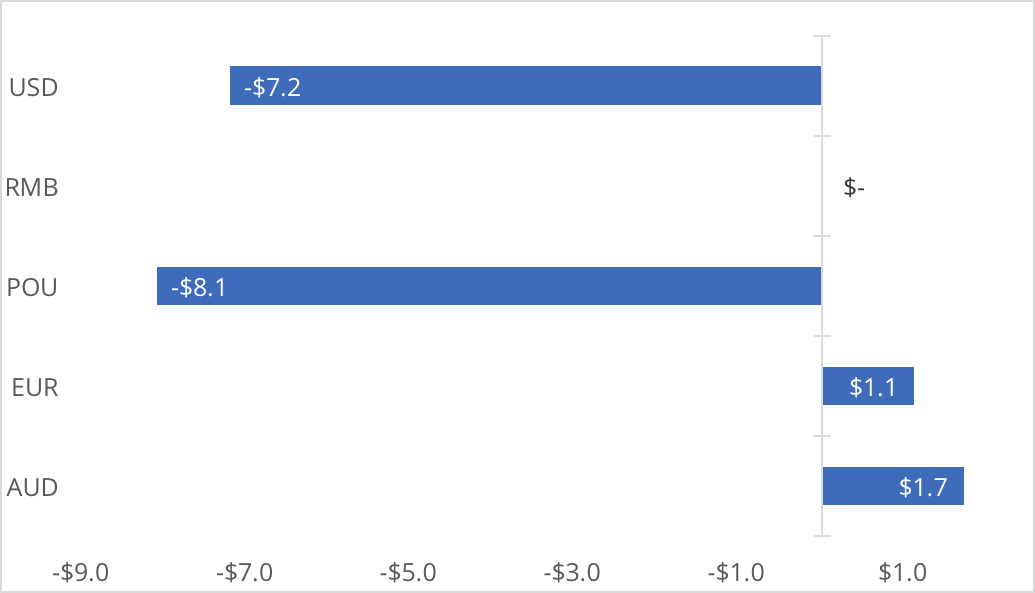
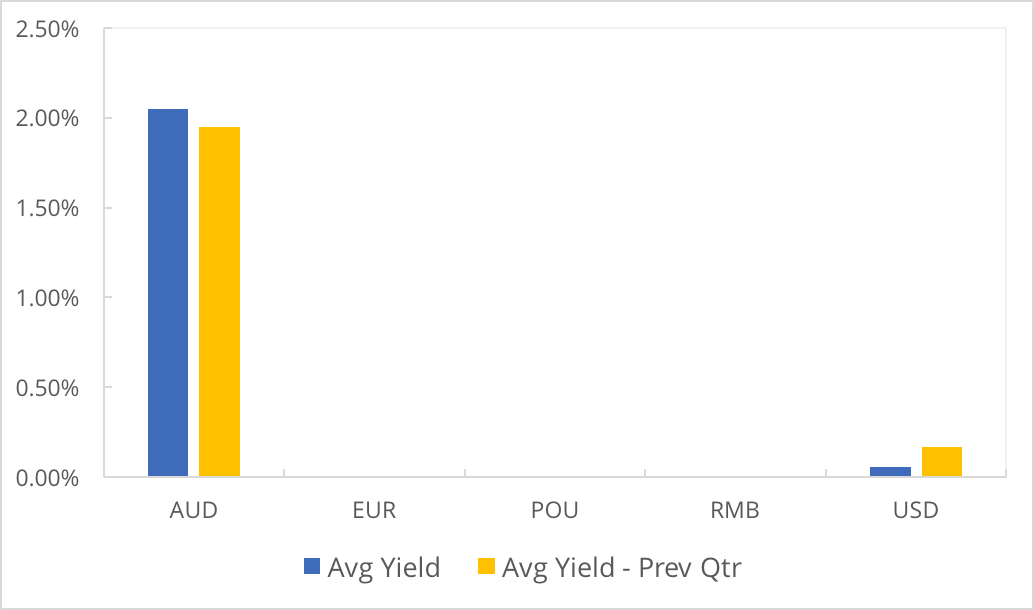
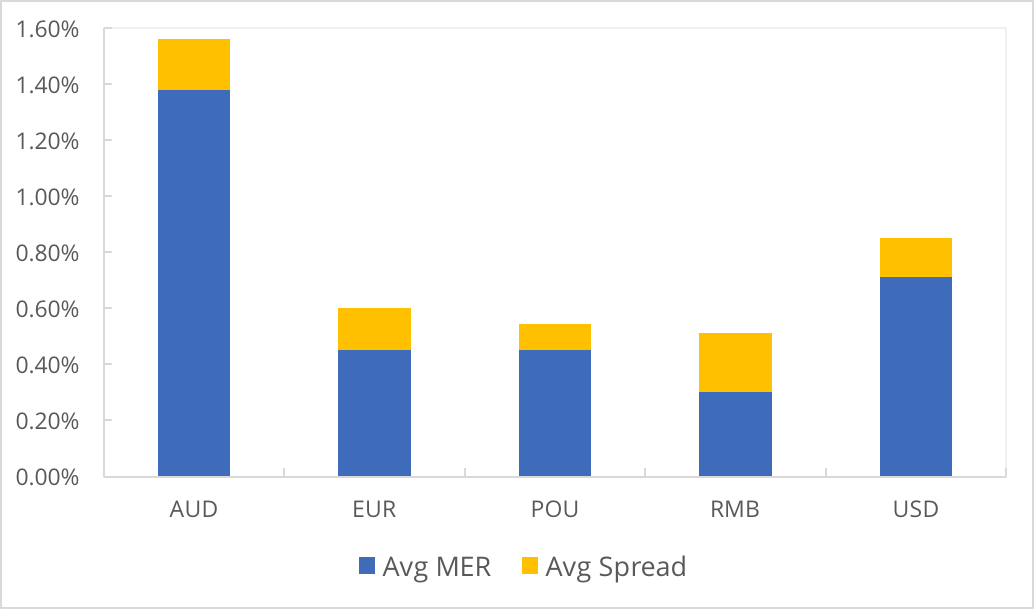
Securities Overview - Currency
Focus: Securities designed to track the performance of the Australian dollar relative to various currencies.
We do not hold any Currency focussed ETFs in our SMA Portfolios.
| Currency | FUM ($m) | Qtr Flows ($m) | No. of Funds |
|---|---|---|---|
| $ 567.00 | -$ 12.50 | 8 |
Source: ASX and Morningstar
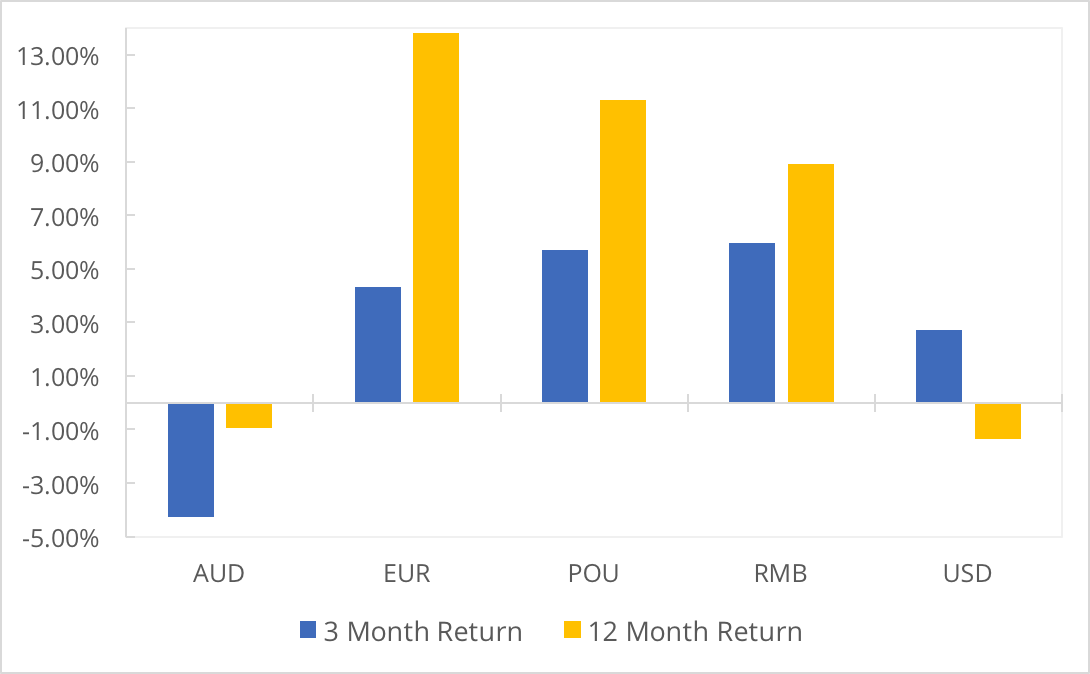
Overview
The weakening AUD is likely due to the Federal Funds rate overtaking the official RBA cash rate for the first time in 19 years.
| Figure 29: Funds Under Management ($m) | Figure 30: Geographic Exposure |
|---|---|
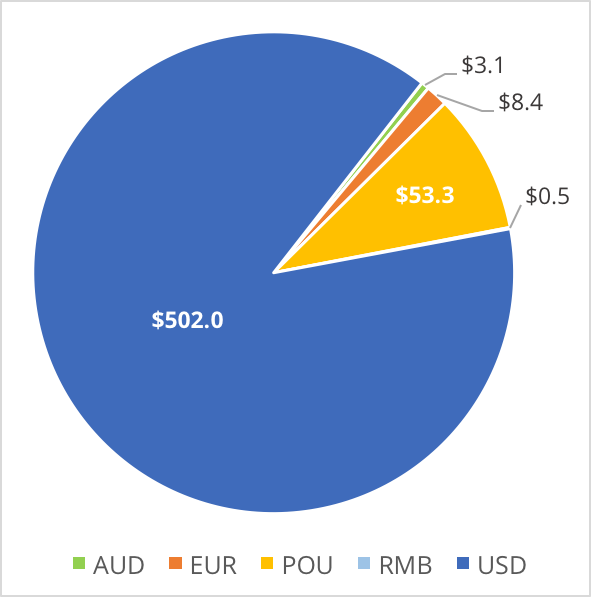 |
 |
| Figure 31: Flows ($m) | Figure 32: Average Yield |
 |
 |
| Figure 33: Average Cost | Figure 34: Average Performance |
 |
 |
Source: ASX and Morningstar
Key Data: Currency ETFs
Figure 35: Currency ETFs
| Name | Total FUM ($M) | Qtr Flows ($M) | MER | Avg Spread | Avg Liquidity | 3MTH Return | 12MTH Return | Yield | Frequency | Structure | Sub Category | STAR Rating | |
|---|---|---|---|---|---|---|---|---|---|---|---|---|---|
| ASIA | |||||||||||||
| RMB | |||||||||||||
| [ZCNH] ETFS Physical Renminbi ETF | 0.49 | 0.00 | 0.30% | 0.21% | 0.90% | 5.98% | 8.93% | 0.00% | Annual | ETF | Miscellaneous | 2 |
|
| EUROPE | |||||||||||||
| EUR | |||||||||||||
| [EEU] BetaShares Euro ETF | 8.42 | 1.12 | 0.45% | 0.15% | 17.12% | 4.31% | 13.82% | 0.00% | Semi-Annual | ETF | Miscellaneous | 3 |
|
| [POU] BetaShares British Pound ETF | 26.66 | -4.06 | 0.45% | 0.09% | 11.27% | 5.72% | 11.30% | 0.00% | Semi-Annual | ETF | Miscellaneous | 3 |
|
| AUSTRALIA | |||||||||||||
| AUD | |||||||||||||
| [AUDS] BetaShares Strong Australian Dollar Hdg | 3.07 | 1.73 | 1.38% | 0.18% | 125.26% | -4.26% | -0.94% | 2.05% | Annual | MF | Alternative Strategies | NR |
|
| USA | |||||||||||||
| USD. | |||||||||||||
| [USD] BetaShares US Dollar ETF | 475.62 | -6.71 | 0.45% | 0.10% | 9.68% | 2.10% | -0.35% | 0.17% | Semi-Annual | ETF | Miscellaneous | 5 |
|
| [YANK] BetaShares Strong US Dollar Hedge | 13.62 | 1.13 | 1.38% | 0.18% | 32.44% | 3.91% | -3.72% | 0.00% | Annual | MF | Alternative Strategies | NR |
|
| [ZUSD] ETFS Physical US Dollar ETF | 12.76 | -1.64 | 0.30% | 0.13% | 8.68% | 2.14% | -0.02% | 0.00% | Annual | ETF | Miscellaneous | 3 |
|
Source: ASX and Morningstar
Securities Overview - Property & Infrastructure
Focus: Securities designed to track various Domestic and Global Property & Infrastructure indexes.
We hold positions in VAP, IFRA & DJRE in our SMA
| Property & Infrastructure | FUM ($m) | Qtr Flows ($m) | No. of Funds |
|---|---|---|---|
| $ 2,119.00 | $ 29.00 | 10 |
Source: ASX and Morningstar
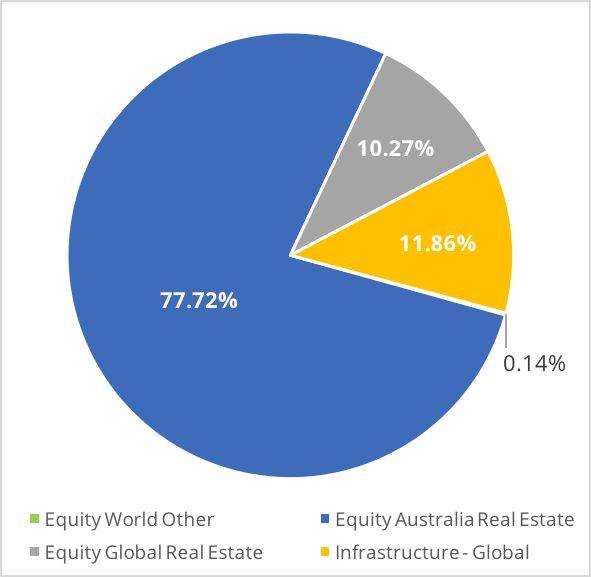
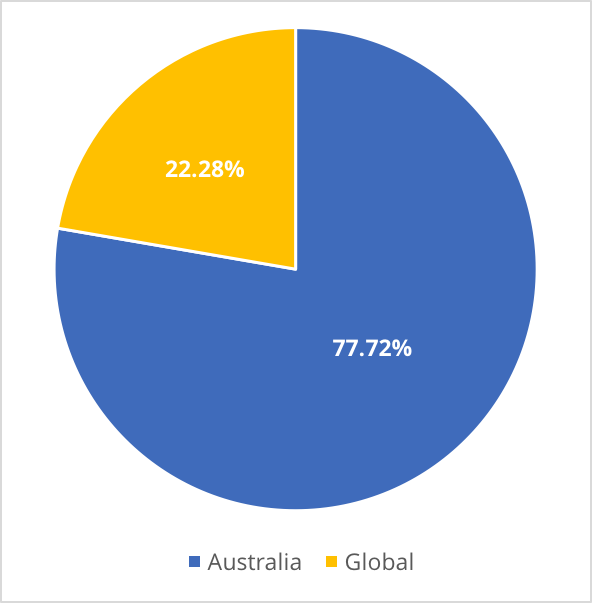
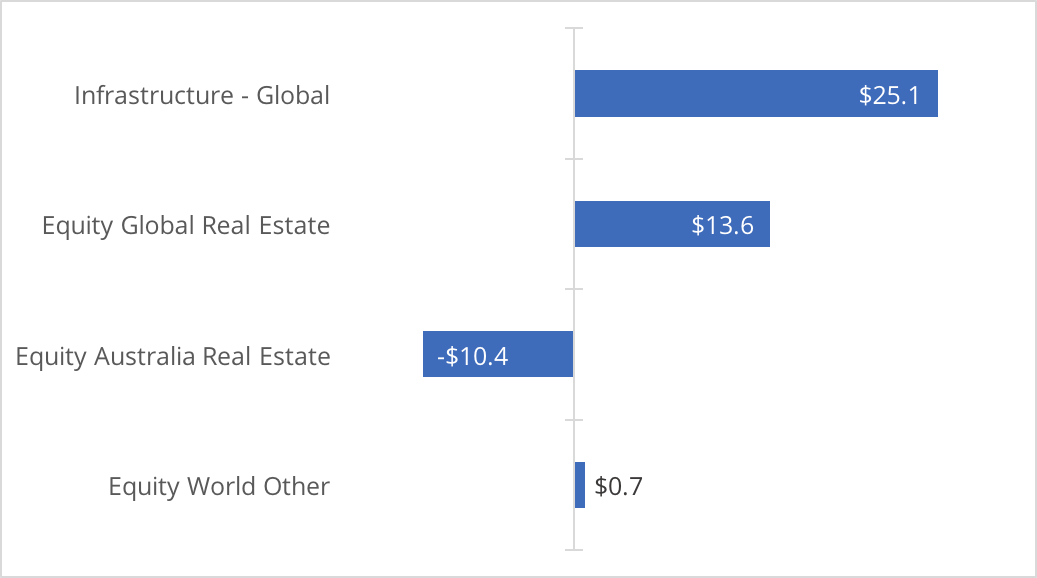
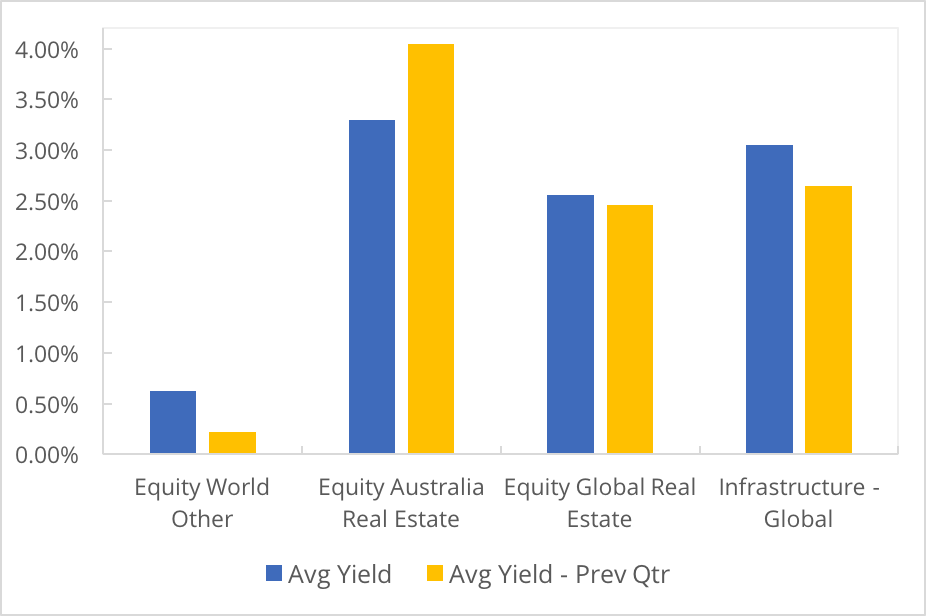
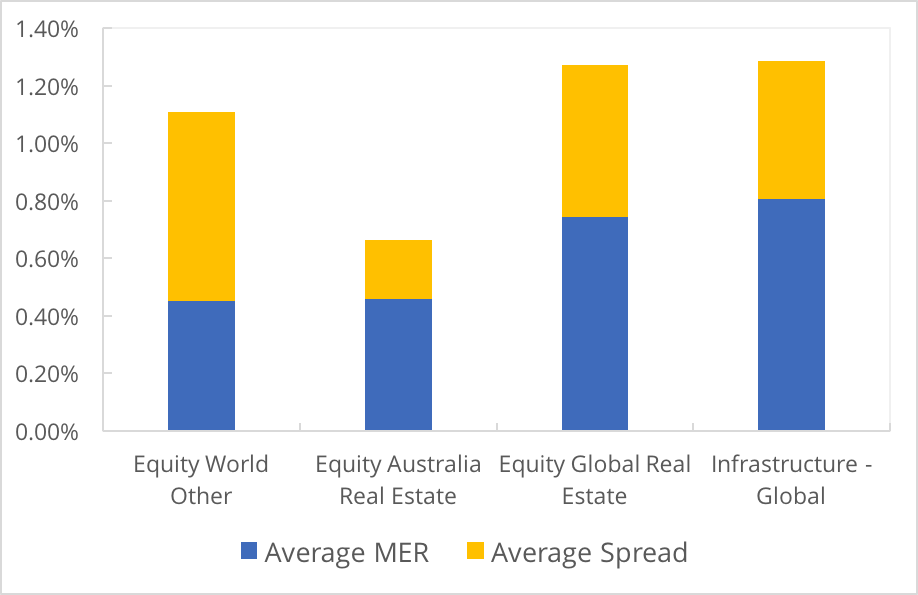
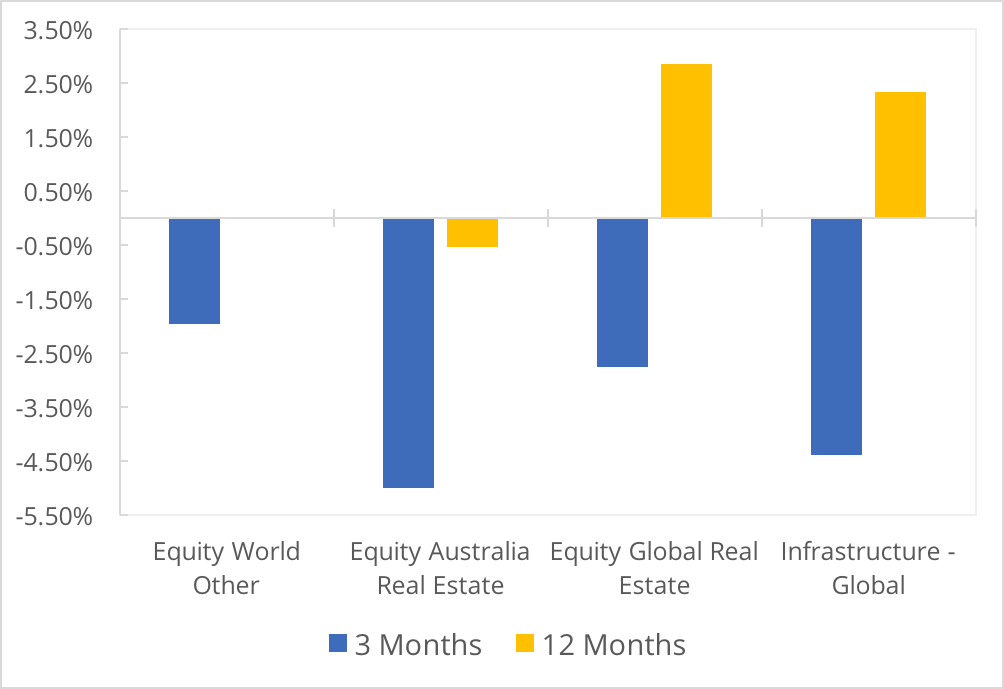
Overview
December saw strong performance across the domestic REIT sector while March saw the opposite. Expectations of rising interest rates globally saw a sell off across both domestic and global REIT and infrastructure assets.
| Figure 36: Funds Under Management ($m) | Figure 37: Geographic Exposure |
|---|---|
 |
 |
| Figure 38: Flows ($m) | Figure 39: Average Yield |
 |
 |
|
Figure 40: Average Cost
|
Figure 41: Average Performance
|
 |
 |
Source: ASX and Morningstar
Invest in the InvestSMART Property and Infrastructure Portfolio
Key Data: Property & Infrastructure ETFs
Figure 42: Property & Infrastructure ETFs
| Name | Total FUM ($M) | Qtr Flows ($M) | MER | Avg Spread | Avg Liquidity | 3MTH Return | 12MTH Return | Yield | Frequency | Structure | Sub Category | STAR Rating | |
|---|---|---|---|---|---|---|---|---|---|---|---|---|---|
| AUSTRALIA | |||||||||||||
| Property | |||||||||||||
| [MVA] VanEck Vectors Australian Property ETF | 102.60 | 32.18 | 0.35% | 0.14% | 16.88% | -7.27% | -0.90% | 6.05% | Semi-Annual | ETF | Equity Australia Real Estate | 4 |
|
| [SLF] SPDR? S&P/ASX 200 Listed Property ETF | 554.19 | -2.48 | 0.40% | 0.16% | 2.70% | -6.49% | -1.10% | 4.06% | Quarterly | ETF | Equity Australia Real Estate | 4 |
|
| [VAP] Vanguard Australian Property Secs ETF | 983.38 | -47.50 | 0.23% | 0.09% | 5.68% | -6.23% | -0.18% | 3.08% | Quarterly | ETF | Equity Australia Real Estate | 4 |
|
| Property & Infrastructure | |||||||||||||
| [RINC] BetaShares Legg Mason Real Income Fund | 7.39 | 7.37 | 0.85% | 0.45% | 6.42% | 0.00% | 0.00% | 0.00% | Quarterly | MF | Equity Australia Real Estate | NR |
|
| GLOBAL | |||||||||||||
| Infrastructure | |||||||||||||
| [GLIN] AMP Capital Global Infras Secs Unhdg | 22.17 | -4.31 | 0.85% | 0.77% | 10.58% | -5.25% | -0.62% | 2.33% | Quarterly | MF | Infrastructure - Global | NR |
|
| [IFRA] VanEck Vectors FTSE Glbl Infras(Hdg)ETF | 70.68 | 11.43 | 0.52% | 0.21% | 14.68% | -5.03% | 1.78% | 4.04% | Quarterly | ETF | Infrastructure - Global | 3 |
|
| [MICH] Magellan Infrastructure Ccy Hdg ETF | 158.63 | 18.00 | 1.05% | 0.46% | 4.83% | -2.93% | 5.81% | 2.78% | Semi-Annual | MF | Infrastructure - Global | NR |
|
| [CORE] ETFS Global Core Infrastructure ETF | 3.03 | 0.74 | 0.45% | 0.66% | 6.79% | -1.97% | 0.00% | 0.62% | Quarterly | ETF | Equity World Other | 2 |
|
| Property | |||||||||||||
| [DJRE] SPDR? Dow Jones Global Real Estate ETF | 204.31 | 16.61 | 0.50% | 0.19% | 5.89% | -3.34% | 0.09% | 3.57% | Semi-Annual | ETF | Equity Global Real Estate | 3 |
|
| [RENT] AMP Capital Global Property Secs Unhdg | 13.49 | -3.06 | 0.99% | 0.86% | 13.24% | -2.19% | 5.60% | 1.55% | Quarterly | MF | Equity Global Real Estate | NR |
|
Source: ASX and Morningstar
Securities Overview - Fixed Income & Cash
Focus: Securities designed to provide investors access to Domestic and Global Fixed Income & Cash Markets.
We hold positions in AAA, FLOT, QPON, VBND, IAF, VACF, VGB & IGB in our SMA Portfolios.
| Fixed Income & Cash | FUM ($m) | Qtr Flows ($m) | No. of Funds |
|---|---|---|---|
| $ 4,340.00 | $ 250.10 | 25 |
Source: ASX and Morningstar
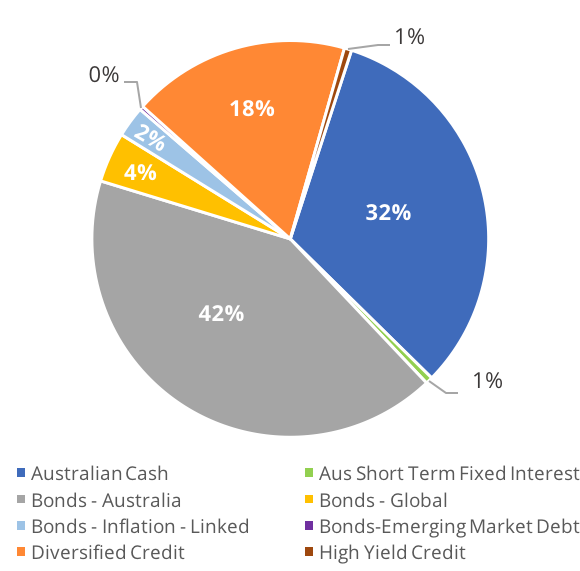
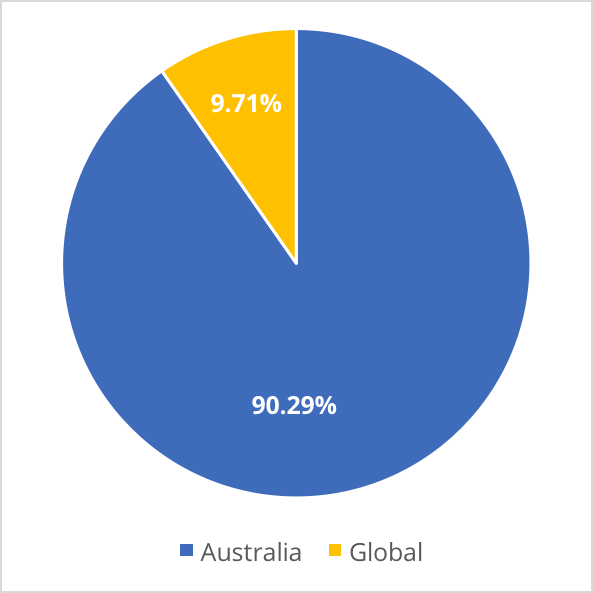
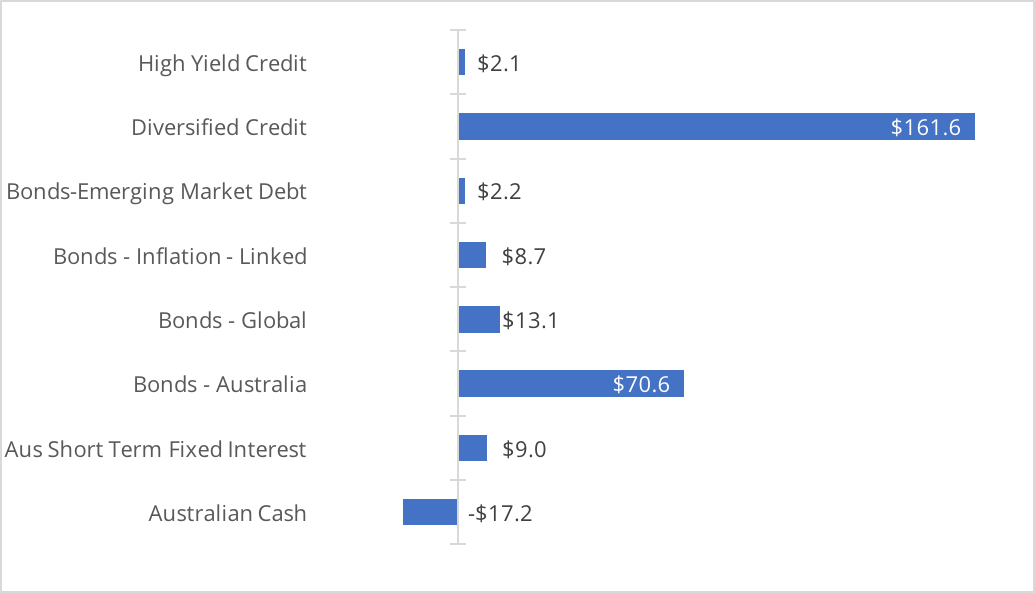
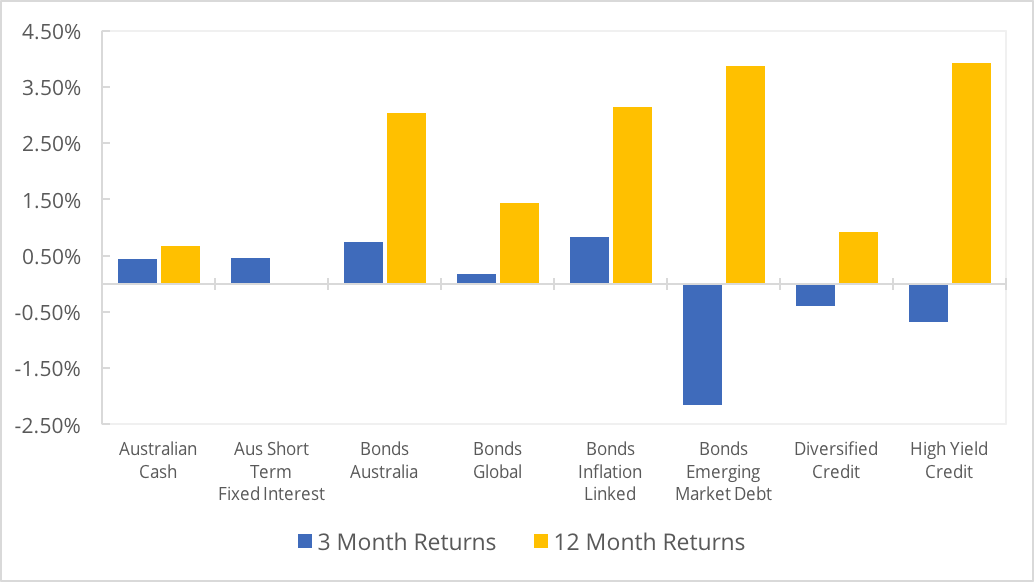
Overview
Diversified credit saw the largest inflows this quarter and following on from last quarter, the largest recipients of these flows were QPON, FLOT & HBRD indicating a continued desire for exposure to floating rate securities.
| Figure 43: Funds Under Management ($m) | Figure 44: Geographic Exposure |
|---|---|
 |
 |
| Figure 45: Flows ($m) | Figure 46: Average Yield |
 |
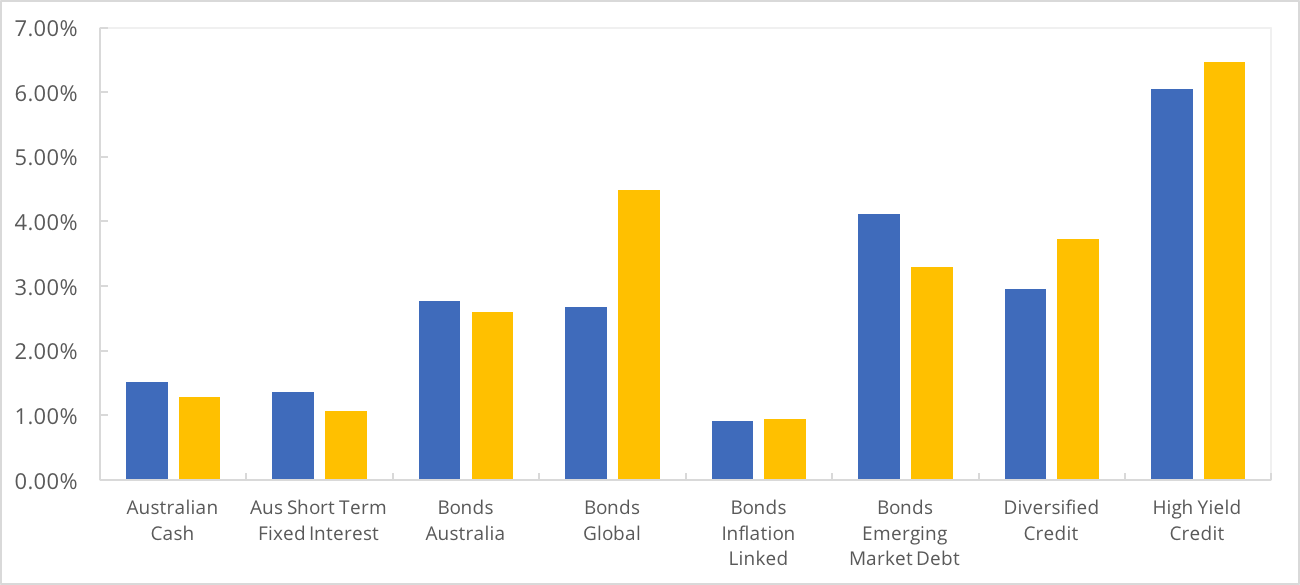 |
|
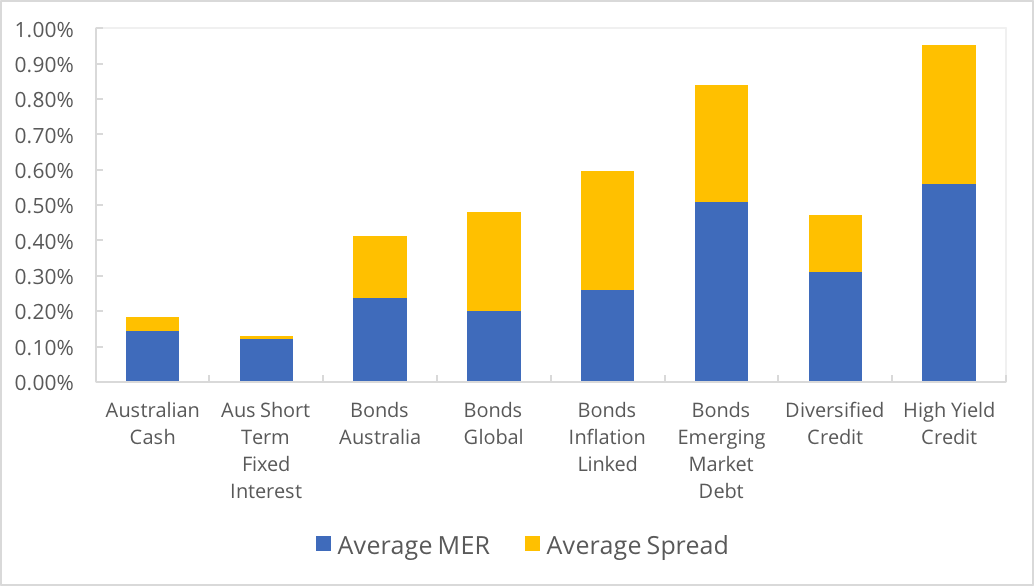
Figure 47: Average Cost
|
Figure 48: Average Performance
|
 |
 |
Source: ASX and Morningstar
with the InvestSMART Hybrid Income Portfolio
Key Data: Fixed Income & Cash ETFs
Figure 49: Fixed Income & Cash ETFs
| Name | Total FUM ($M) | Qtr Flows ($M) | MER | Avg Spread | Avg Liquidity | 3MTH Return | 12MTH Return | Yield | Frequency | Structure | Sub Category | STAR Rating | |
|---|---|---|---|---|---|---|---|---|---|---|---|---|---|
| GLOBAL | |||||||||||||
| Corporate | |||||||||||||
| [IHCB] iShares Core Global Corp Bd AUDH ETF | 88.50 | 4.15 | 0.26% | 0.25% | 15.80% | -1.66% | 2.58% | 2.99% | Tri-Annual | ETF | Diversified Credit | 3 |
|
| [IHHY] iShares Global High Yield Bond AUDH ETF | 25.60 | 2.13 | 0.56% | 0.39% | 19.42% | -0.68% | 3.93% | 6.05% | Tri-Annual | ETF | High Yield Credit | 2 |
|
| Diversified | |||||||||||||
| [IHEB] iShares JP Morgan USD EmMkts Bd AUDH ETF | 13.81 | 2.15 | 0.51% | 0.33% | 18.12% | -2.15% | 3.87% | 4.12% | Tri-Annual | ETF | Bonds-Emerging Market Debt | 2 |
|
| [VCF] Vanguard Intl Credit Secs Idx (Hdg) ETF | 116.25 | 5.77 | 0.30% | 0.26% | 5.19% | -1.01% | 2.90% | 6.64% | Quarterly | ETF | Diversified Credit | 3 |
|
| [VBND] Vanguard Global Aggregate Bd Hdg ETF | 8.04 | 3.51 | 0.20% | 0.31% | 28.15% | -0.20% | 0.00% | 0.73% | Quarterly | ETF | Bonds - Global | 2 |
|
| Government | |||||||||||||
| [VIF] Vanguard Intl Fxd Intr Idx (Hdg) ETF | 169.23 | 9.61 | 0.20% | 0.25% | 7.58% | 0.55% | 2.86% | 4.63% | Quarterly | ETF | Bonds - Global | 3 |
|
| AUSTRALIA | |||||||||||||
| Cash | |||||||||||||
| [AAA] BetaShares Aus High Interest Cash ETF | 1,233.89 | -23.24 | 0.18% | 0.02% | 15.41% | 0.50% | 2.02% | 2.00% | Monthly | ETF | Australian Cash | 5 |
|
| [BILL] iShares Core Cash ETF | 169.87 | 6.02 | 0.07% | 0.01% | 3.76% | 0.43% | 0.00% | 1.16% | Monthly | ETF | Australian Cash | 5 |
|
| [ISEC] iShares Enhanced Cash ETF | 25.08 | 9.03 | 0.12% | 0.01% | 16.95% | 0.45% | 0.00% | 1.37% | Monthly | ETF | Australian Short Term Fixed Interest | 4 |
|
| [MONY] UBS IQ Cash ETF | 1.00 | 0.00 | 0.18% | 0.09% | 1.03% | 0.38% | 0.00% | 1.40% | Monthly | ETF | Australian Cash | 4 |
|
| Corporate | |||||||||||||
| [PLUS] VanEck Vectors Australian Corp Bd ETF | 177.14 | 25.14 | 0.32% | 0.19% | 6.97% | 0.93% | 0.00% | 2.76% | Quarterly | ETF | Diversified Credit | 3 |
|
| [RCB] Russell Inv Australian Select CorpBd ETF | 159.50 | 6.09 | 0.28% | 0.24% | 4.62% | 0.53% | 2.72% | 4.11% | Quarterly | ETF | Bonds - Australia | 3 |
|
| [VACF] Vanguard Australian Corp Fxd Intr ETF | 100.09 | 15.89 | 0.26% | 0.23% | 7.29% | 0.83% | 4.12% | 2.66% | Quarterly | ETF | Bonds - Australia | 3 |
|
| [FLOT] VanEck Vectors Australian Fltng Rt ETF | 81.14 | 29.09 | 0.22% | 0.08% | 16.82% | 0.43% | 0.00% | 1.90% | Monthly | ETF | Diversified Credit | 4 |
|
| [QPON] Betashares Aus Bank Sr Fltng Rt Bd ETF | 247.17 | 57.44 | 0.22% | 0.04% | 12.94% | 0.13% | 0.00% | 1.98% | Monthly | ETF | Diversified Credit | 4 |
|
| Diversified | |||||||||||||
| [IAF] iShares Core Composite Bond ETF | 528.78 | 31.77 | 0.20% | 0.08% | 6.01% | 0.83% | 3.08% | 2.34% | Quarterly | ETF | Bonds - Australia | 4 |
|
| [VAF] Vanguard Australian Fixed Interest ETF | 704.31 | 22.58 | 0.20% | 0.06% | 4.51% | 0.84% | 3.12% | 2.89% | Quarterly | ETF | Bonds - Australia | 4 |
|
| Government | |||||||||||||
| [BOND] SPDR? S&P/ASX Australian Bond ETF | 23.47 | -5.09 | 0.24% | 0.17% | 6.57% | 0.79% | 3.60% | 2.76% | Quarterly | ETF | Bonds - Australia | 3 |
|
| [GOVT] SPDR? S&P/ASX Australian Govt Bd ETF | 12.94 | 0.00 | 0.22% | 0.16% | 11.28% | 0.85% | 3.40% | 2.21% | Quarterly | ETF | Bonds - Australia | 3 |
|
| [IGB] iShares Treasury ETF | 25.63 | 4.09 | 0.26% | 0.16% | 22.21% | 0.95% | 3.01% | 2.56% | Quarterly | ETF | Bonds - Australia | 3 |
|
| [ILB] iShares Government Inflation ETF | 109.38 | 8.73 | 0.26% | 0.34% | 7.58% | 0.83% | 3.14% | 0.91% | Quarterly | ETF | Bonds - Inflation - Linked | 3 |
|
| [RGB] Russell Inv Australian Government Bd ETF | 60.18 | 0.01 | 0.24% | 0.27% | 1.25% | 0.57% | 2.39% | 2.80% | Quarterly | ETF | Bonds - Australia | 3 |
|
| [RSM] Russell Inv Australian Semi-Govt Bd ETF | 61.00 | 0.03 | 0.26% | 0.27% | 2.66% | 0.42% | 1.95% | 2.44% | Quarterly | ETF | Bonds - Australia | 3 |
|
| [VGB] Vanguard Australian Government Bond ETF | 137.50 | -4.78 | 0.20% | 0.12% | 6.33% | 0.89% | 2.98% | 2.92% | Quarterly | ETF | Bonds - Australia | 4 |
|
| Hybrids | |||||||||||||
| [HBRD] BetaShares Active Australian Hybrids Fund (managed fund) | 60.92 | 40.01 | 0.55% | 0.14% | 31.00% | -1.17% | 0.00% | 1.42% | Monthly | MF | Diversified Credit | NR |
|
Source: ASX and Morningstar
Securities Overview - Diversified
Focus: Securities designed to provide investors with diversified multi sector asset allocation.
We manage a range of diversified SMA Portfolios.
| Diversified | FUM ($m) | Qtr Flows ($m) | No. of Funds |
|---|---|---|---|
| $ 78.00 | $ 56.60 | 4 |
Source: ASX and Morningstar
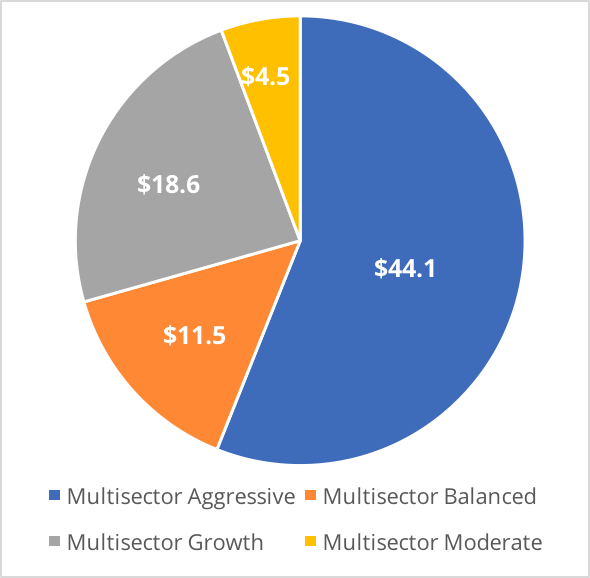
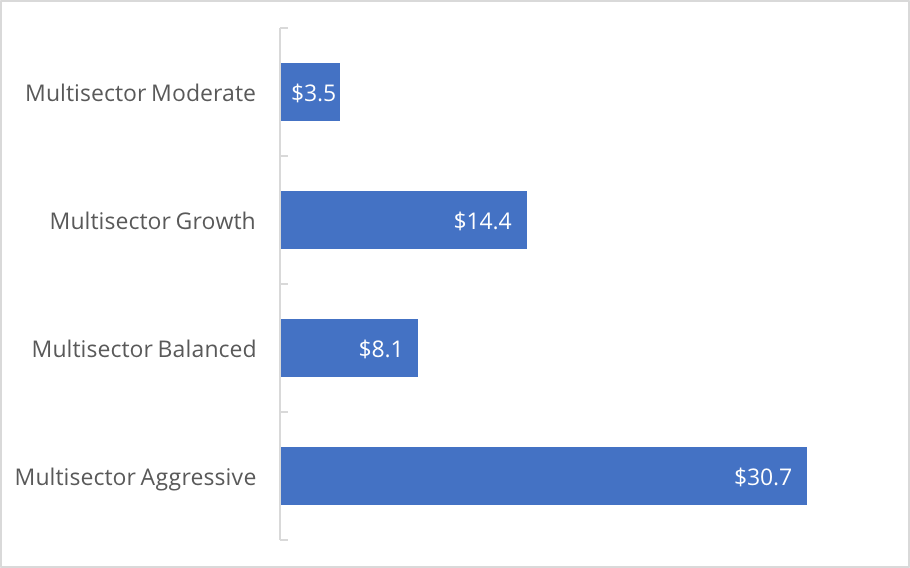
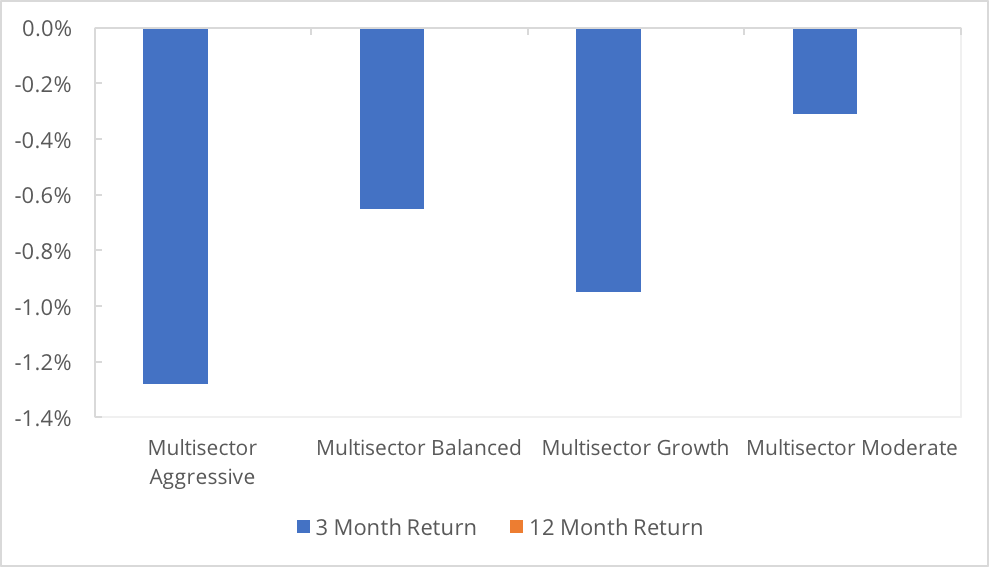
Overview
Although coming off a small base, the diversified sector almost doubled during the quarter with the majority of flows directed to the “multisector aggressive” sub category. However, negative equity market performance saw the growth orientated funds post the worst returns for the quarter.
| Figure 51: Funds Under Management ($m) | Figure 52: Geographic Exposure |
|---|---|
 |
|
| Figure 53: Flows ($m) | Figure 54: Average Yield |
 |
|
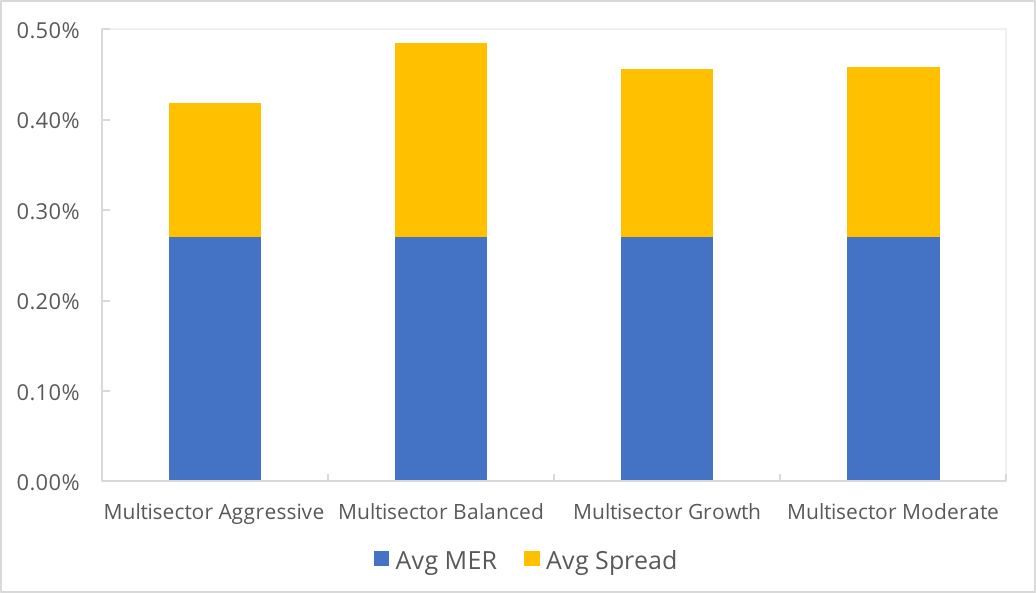
| Figure 55: Average Cost | Figure 56: Average Performance |
 |
 |
Source: ASX and Morningstar
with the InvestSMART diversified portfolios
Key Data: Diversified ETFs
Figure 57: Diversified ETFs
| Name | Total FUM ($M) | Qtr Flows ($M) | MER | Avg Spread | Avg Liquidity | 3MTH Return | 12MTH Return | Yield | Frequency | Structure | Sub Category | STAR Rating | |
|---|---|---|---|---|---|---|---|---|---|---|---|---|---|
| GLOBAL | |||||||||||||
| Balanced | |||||||||||||
| [VDBA] Vanguard Diversified Balanced ETF | 11.46 | 8.05 | 0.27% | 0.22% | 38.41% | -0.65% | 0.00% | 0.58% | Quarterly | ETF | Multisector Balanced | 2 |
|
| Conservative | |||||||||||||
| [VDCO] Vanguard Diversified Conservative ETF | 4.49 | 3.50 | 0.27% | 0.19% | 41.87% | -0.31% | 0.00% | 0.64% | Quarterly | ETF | Multisector Moderate | 2 |
|
| High Growth | |||||||||||||
| [VDHG] Vanguard Diversified High Growth ETF | 44.11 | 30.69 | 0.27% | 0.15% | 35.72% | -1.28% | 0.00% | 0.96% | Quarterly | ETF | Multisector Aggressive | 3 |
|
| Growth | |||||||||||||
| [VDGR] Vanguard Diversified Growth ETF | 18.64 | 14.38 | 0.27% | 0.19% | 37.43% | -0.95% | 0.00% | 0.84% | Quarterly | ETF | Multisector Growth | 3 |
|
Source: ASX and Morningstar
Securities Overview - Equities
Focus: This group of securities provides the investor with broad-based as well as specific sector exposure across domestic and international equity markets.
We hold positions in IAA, IVV, VEQ, VEU, UMAX, VGS & IOZ our SMA Portfolios.
| Equities | FUM ($m) | Qtr Flows ($m) | No. of Funds |
|---|---|---|---|
| $ 28,332.00 | $ 1,999.50 | 120 |
Source: ASX and Morningstar
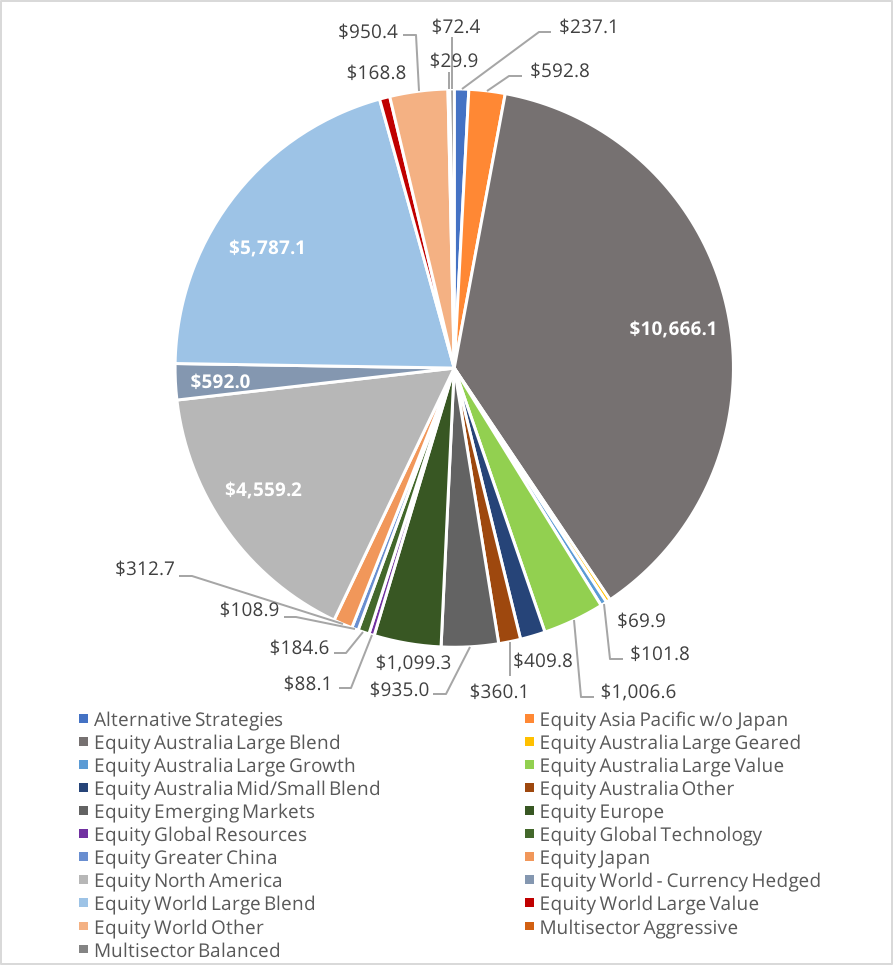
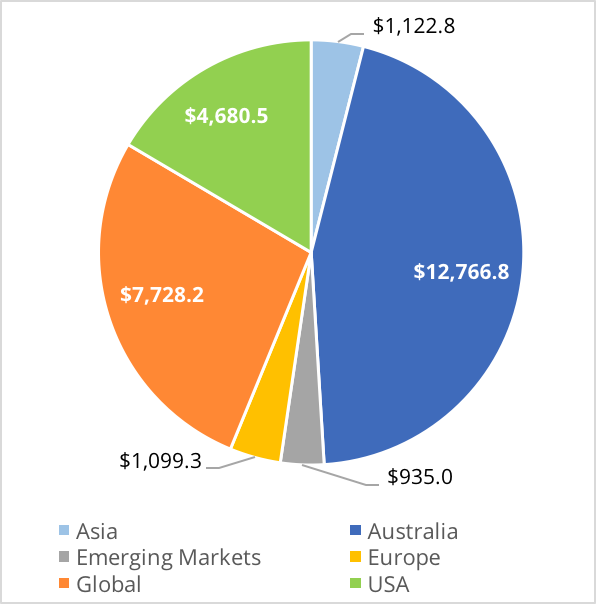
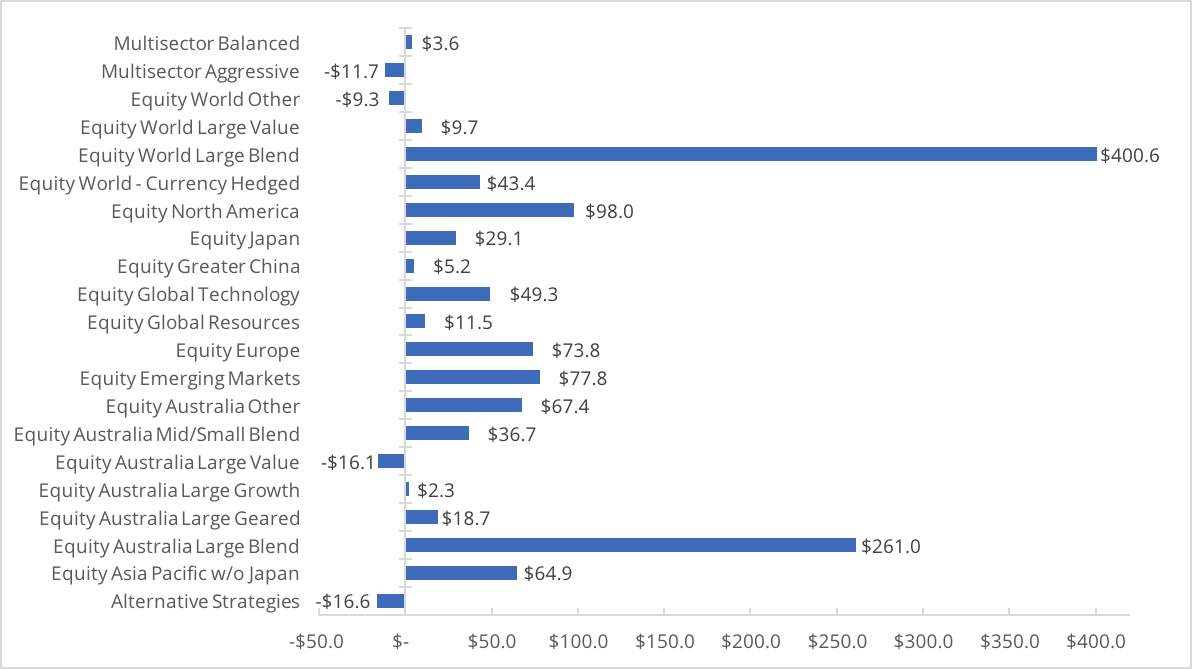
Overview
Global tech was the best performing sector on average during the March quarter. With upgrades to global growth expectations, $400m if net inflows were directed to large cap global equity, with 50% of this going to Vanguard alone.
| Figure 58: Funds Under Management ($m) | Figure 59: Geographic Exposure |
|---|---|
 |
 |
| Figure 60: Flows ($m) | |
 |
|
| Figure 61: Average Yield | |
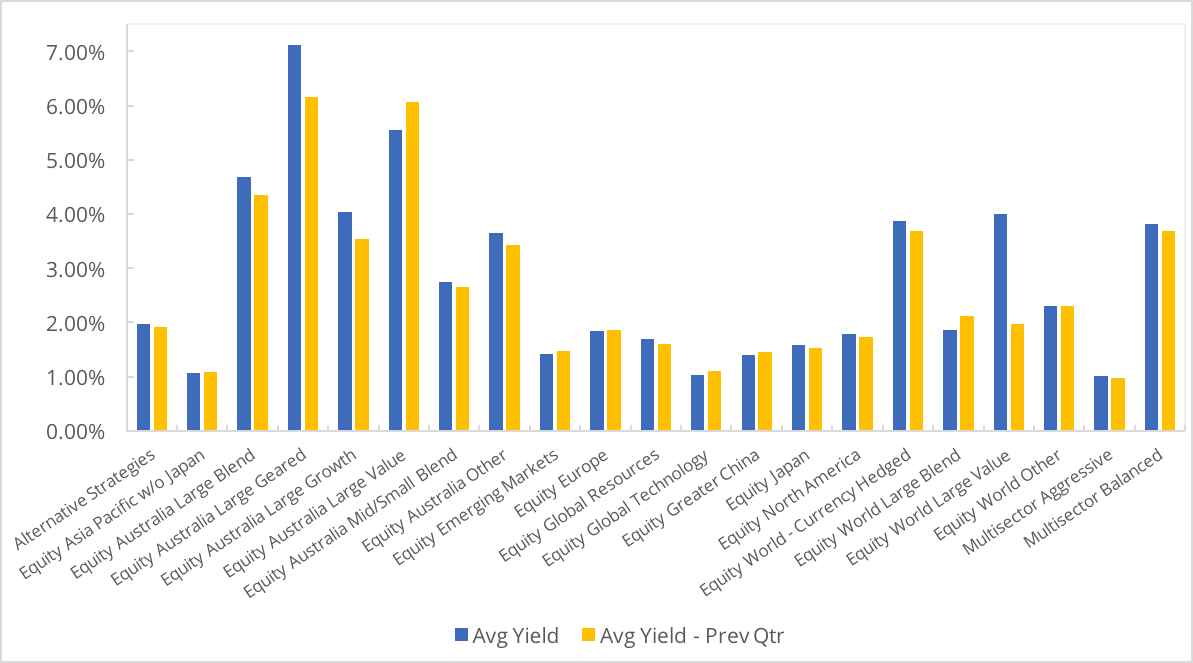 |
|
| Figure 62: Average Cost | |
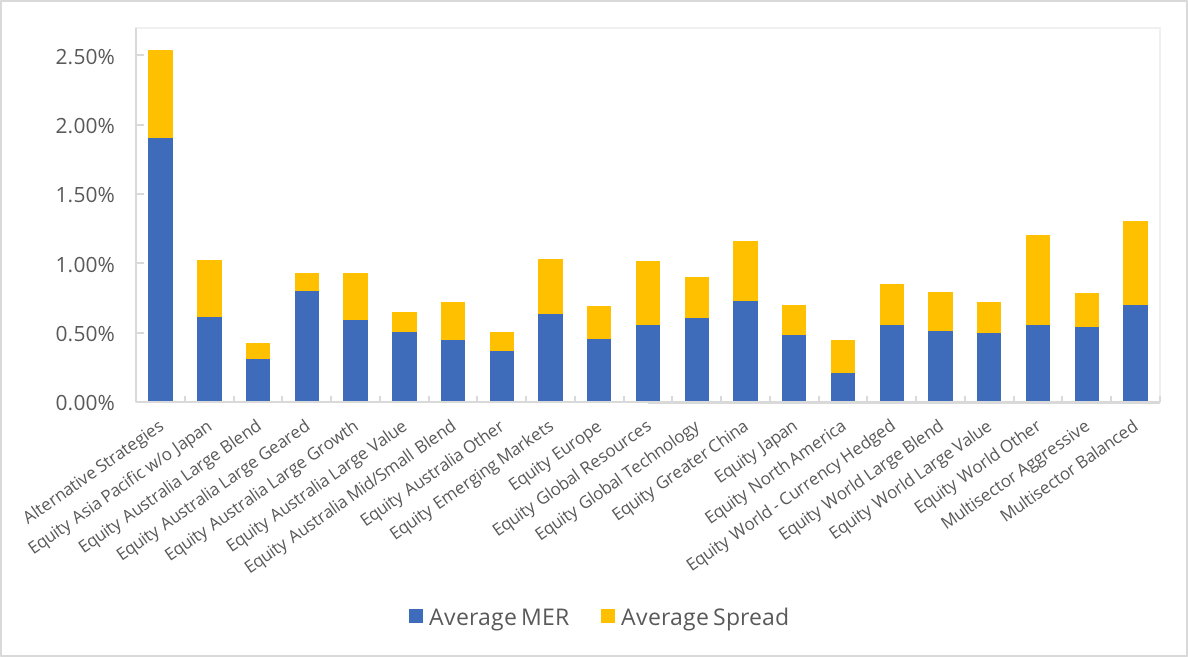 |
|
| Figure 63: Average Performance | |
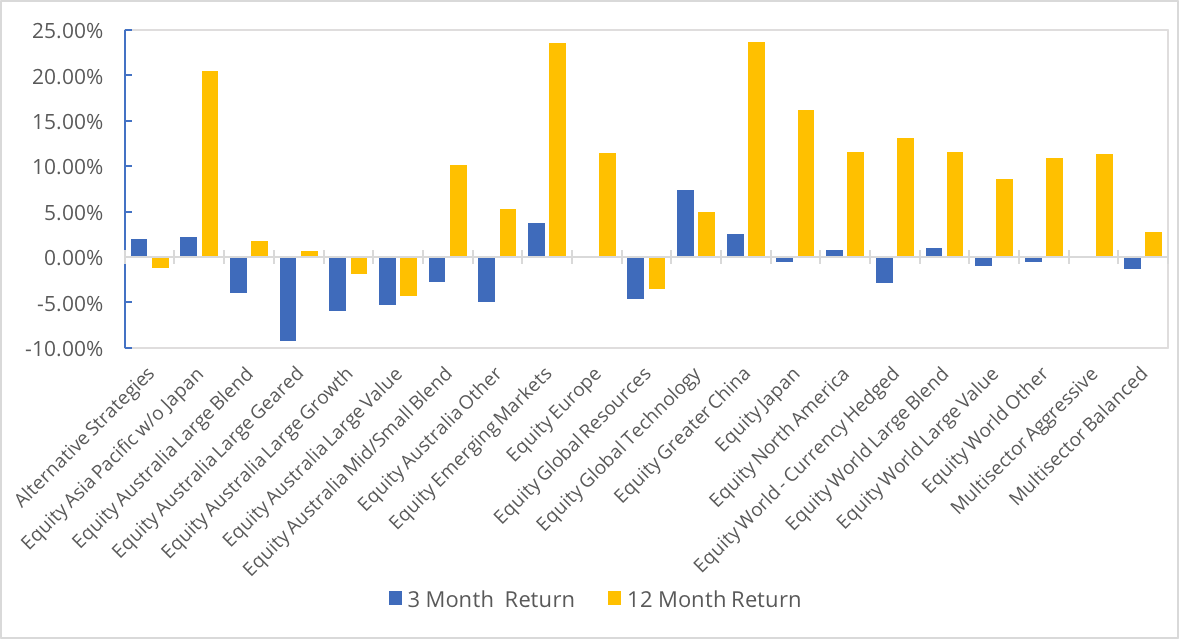 |
|
Source: ASX and Morningstar
Invest in the InvestSMART International Equities Portfolio
Key Data: Equity ETFs
Figure 64: Equity ETFs Europe
| Name | Total FUM ($M) | Qtr Flows ($M) | MER | Avg Spread | Avg Liquidity | 3MTH Return | 12MTH Return | Yield | Frequency | Structure | Sub Category | STAR Rating | |
|---|---|---|---|---|---|---|---|---|---|---|---|---|---|
| EUROPE | |||||||||||||
| Equities - Broad | |||||||||||||
| [ESTX] ETFS EURO STOXX 50? ETF | 68.20 | 17.61 | 0.35% | 0.15% | 19.85% | 0.44% | 12.49% | 1.16% | Semi-Annual | ETF | Equity Europe | 3 |
|
| [HEUR] BetaShares WisdomTree Europe ETF-Ccy Hdg | 50.42 | -1.15 | 0.58% | 0.21% | 15.56% | -1.63% | 2.19% | 1.50% | Semi-Annual | ETF | Equity Europe | 2 |
|
| [IEU] iShares Europe ETF (AU) | 807.04 | 34.22 | 0.60% | 0.12% | 7.24% | -0.22% | 13.28% | 2.05% | Semi-Annual | ETF | Equity Europe | 4 |
|
| [VEQ] Vanguard FTSE Europe Shares ETF | 162.54 | 22.26 | 0.35% | 0.38% | 9.40% | 0.57% | 14.62% | 2.14% | Quarterly | ETF | Equity Europe | 3 |
|
| Equities - Strategy | |||||||||||||
| [UBE] UBS IQ MSCI Europe Ethical ETF | 11.12 | 0.89 | 0.40% | 0.34% | 4.63% | 0.20% | 14.40% | 2.41% | Annual | ETF | Equity Europe | 2 |
|
Source: ASX and Morningstar
Figure 65: Breakdown - Equity ETFs Emerging Markets
| Name | Total FUM ($M) | Qtr Flows ($M) | MER | Avg Spread | Avg Liquidity | 3MTH Return | 12MTH Return | Yield | Frequency | Structure | Sub Category | STAR Rating | |
|---|---|---|---|---|---|---|---|---|---|---|---|---|---|
| EMERGING MARKETS | |||||||||||||
| Equities - Broad | |||||||||||||
| [IBK] iShares MSCI BRIC ETF (AU) | 39.13 | 2.36 | 0.72% | 0.90% | 8.65% | 4.32% | 28.49% | 1.23% | Semi-Annual | ETF | Equity Emerging Markets | 2 |
|
| [IEM] iShares MSCI Emerging Markets ETF (AU) | 665.77 | 45.24 | 0.69% | 0.18% | 6.54% | 3.14% | 23.21% | 1.56% | Semi-Annual | ETF | Equity Emerging Markets | 3 |
|
| [VGE] Vanguard FTSE Emerging Markets Shrs ETF | 209.15 | 26.88 | 0.48% | 0.26% | 13.47% | 4.40% | 19.70% | 1.65% | Quarterly | ETF | Equity Emerging Markets | 3 |
|
| [WEMG] SPDR? S&P Emerging Markets ETF | 20.99 | 3.36 | 0.65% | 0.26% | 21.52% | 3.27% | 22.94% | 1.26% | Annual | ETF | Equity Emerging Markets | 2 |
|
Source: ASX and Morningstar
Figure 66: Equity ETFs USA
| Name | Total FUM ($M) | Qtr Flows ($M) | MER | Avg Spread | Avg Liquidity | 3MTH Return | 12MTH Return | Yield | Frequency | Structure | Sub Category | STAR Rating | |
|---|---|---|---|---|---|---|---|---|---|---|---|---|---|
| USA | |||||||||||||
| Equities - Broad | |||||||||||||
| [IJH] iShares S&P Mid-Cap ETF | 140.67 | 17.55 | 0.07% | 0.30% | 18.98% | 1.19% | 10.31% | 1.09% | Quarterly | ETF | Equity North America | 4 |
|
| [IJR] iShares S&P Small-Cap ETF | 109.63 | 1.17 | 0.07% | 0.49% | 5.77% | 2.64% | 12.06% | 1.02% | Quarterly | ETF | Equity North America | 4 |
|
| [IRU] iShares Russell 2000 ETF (AU) | 74.04 | -2.45 | 0.20% | 0.35% | 4.66% | 1.89% | 11.14% | 1.03% | Quarterly | ETF | Equity North America | 3 |
|
| [IVV] iShares S&P 500 ETF | 2,490.31 | 23.42 | 0.04% | 0.09% | 4.71% | 1.20% | 13.29% | 1.55% | Quarterly | ETF | Equity North America | 5 |
|
| [NDQ] BetaShares NASDAQ 100 ETF | 262.33 | 8.69 | 0.48% | 0.11% | 14.69% | 5.01% | 20.93% | 0.40% | Semi-Annual | ETF | Equity North America | 4 |
|
| [QUS] BetaShares FTSE RAFI US 1000 ETF | 38.39 | 0.02 | 0.40% | 0.14% | 4.94% | -0.65% | 8.63% | 2.20% | Semi-Annual | ETF | Equity North America | 3 |
|
| [SPY] SPDR? S&P 500 ETF | 19.16 | -0.15 | 0.09% | 0.29% | 9.82% | 1.17% | 13.21% | 1.62% | Quarterly | ETF | Equity North America | 3 |
|
| [VTS] Vanguard US Total Market Shares ETF | 1,206.99 | 41.75 | 0.04% | 0.10% | 4.28% | 1.37% | 13.21% | 1.47% | Quarterly | ETF | Equity North America | 4 |
|
| Equities - Strategy | |||||||||||||
| [GGUS] BetaShares Geared US Eq- Ccy Hdg | 17.28 | 5.20 | 0.80% | 0.14% | 91.43% | -5.57% | 22.57% | 0.69% | Annual | MF | Equity World - Currency Hedged | NR |
|
| [IHVV] iShares S&P 500 AUD Hedged ETF | 108.70 | 9.75 | 0.10% | 0.18% | 11.04% | -1.43% | 13.45% | 1.80% | Annual | ETF | Equity North America | 3 |
|
| [UBU] UBS IQ MSCI USA Ethical ETF | 6.31 | 0.00 | 0.20% | 0.20% | 2.13% | 1.19% | 12.78% | 1.90% | Annual | ETF | Equity North America | 2 |
|
| [UMAX] BetaShares S&P 500 Yield Maximiser | 89.81 | 0.08 | 0.79% | 0.19% | 6.09% | -0.76% | 6.98% | 4.41% | Quarterly | MF | Equity World Other | NR |
|
| [ZYUS] ETFS S&P 500 High Yield Low Volatil ETF | 49.96 | -4.17 | 0.35% | 0.22% | 10.03% | -4.31% | -1.19% | 6.36% | Quarterly | ETF | Equity North America | 2 |
|
| [BBUS] BetaShares US Eqs Strong Bear H-Ccy Hdg | 66.90 | 7.14 | 1.38% | 0.26% | 71.14% | -0.62% | -27.65% | 0.00% | Annual | MF | Alternative Strategies | NR |
|
Source: ASX and Morningstar
Figure 67: Equity ETFs, Asia
| Name | Total FUM ($M) | Qtr Flows ($M) | MER | Avg Spread | Avg Liquidity | 3MTH Return | 12MTH Return | Yield | Frequency | Structure | Sub Category | STAR Rating | |
|---|---|---|---|---|---|---|---|---|---|---|---|---|---|
| ASIA | |||||||||||||
| Equities - Broad | |||||||||||||
| [CETF] Market Vectors ChinaAMC A-Share ETF(Syn) | 9.86 | 0.54 | 0.72% | 0.42% | 20.87% | 2.23% | 24.00% | 0.92% | Annual | ETF | Equity Greater China | 2 |
|
| [HJPN] BetaShares WisdomTree Japan ETF-Ccy Hdg | 70.26 | -0.89 | 0.58% | 0.20% | 20.13% | -5.81% | 12.99% | 2.34% | Semi-Annual | ETF | Equity Japan | 3 |
|
| [IAA] iShares Asia 50 ETF (AU) | 422.59 | 26.52 | 0.50% | 0.46% | 5.67% | 3.75% | 28.95% | 1.17% | Semi-Annual | ETF | Equity Asia Pacific w/o Japan | 3 |
|
| [IHK] iShares MSCI Hong Kong ETF (AU) | 15.06 | -1.94 | 0.48% | 1.23% | 19.46% | 0.45% | 17.12% | 3.68% | Semi-Annual | ETF | Equity World Other | 2 |
|
| [IJP] iShares MSCI Japan ETF (AU) | 237.88 | 29.98 | 0.48% | 0.22% | 10.67% | 2.00% | 17.75% | 1.05% | Semi-Annual | ETF | Equity Japan | 3 |
|
| [IKO] iShares MSCI South Korea ETF (AU) | 40.54 | 0.00 | 0.64% | 0.87% | 4.75% | 1.51% | 23.08% | 2.42% | Annual | ETF | Equity World Other | 2 |
|
| [ISG] iShares MSCI Singapore ETF | 6.11 | -0.52 | 0.48% | 1.02% | 3.91% | 3.70% | 19.20% | 2.83% | Semi-Annual | ETF | Equity World Other | 2 |
|
| [ITW] iShares MSCI Taiwan ETF | 46.73 | -1.23 | 0.64% | 1.36% | 1.42% | 6.50% | 16.54% | 2.21% | Annual | ETF | Equity World Other | 2 |
|
| [IZZ] iShares China Large-Cap ETF (AU) | 99.01 | 4.64 | 0.74% | 0.44% | 16.48% | 2.72% | 23.41% | 1.89% | Semi-Annual | ETF | Equity Greater China | 2 |
|
| [VAE] Vanguard FTSE Asia ex Japan Shrs Idx ETF | 71.08 | 17.84 | 0.40% | 0.37% | 20.80% | 2.08% | 22.07% | 2.80% | Quarterly | ETF | Equity Asia Pacific w/o Japan | 3 |
|
| [PAXX] Platinum Asia (Quoted Managed Hdg) | 89.99 | 20.49 | 1.10% | 0.46% | 10.73% | -0.26% | 0.00% | 0.00% | Annual | MF | Equity Asia Pacific w/o Japan | NR |
|
| Equities - Strategy | |||||||||||||
| [UBJ] UBS IQ MSCI Japan Ethical ETF | 4.51 | 0.00 | 0.40% | 0.22% | 4.48% | 2.01% | 17.74% | 1.39% | Annual | ETF | Equity Japan | 2 |
|
| [UBP] UBS IQ MSCI Asia APEX 50 Ethical ETF | 9.17 | 0.00 | 0.45% | 0.35% | 13.91% | 3.13% | 31.11% | 0.31% | Annual | ETF | Equity Asia Pacific w/o Japan | 2 |
|
Source: ASX and Morningstar
Figure 68: Equity ETFs Australia
| Name | Total FUM ($M) | Qtr Flows ($M) | MER | Avg Spread | Avg Liquidity | 3MTH Return | 12MTH Return | Yield | Frequency | Structure | Sub Category | STAR Rating | |
|---|---|---|---|---|---|---|---|---|---|---|---|---|---|
| AUSTRALIA | |||||||||||||
| Equities - Broad | |||||||||||||
| [EX20] BetaShares Aus Ex-20 Port Divrs ETF | 25.75 | 3.44 | 0.25% | 0.15% | 13.15% | -2.15% | 11.95% | 2.15% | Semi-Annual | ETF | Equity Australia Large Blend | 3 |
|
| [ILC] iShares S&P/ASX 20 ETF | 306.33 | 0.30 | 0.24% | 0.08% | 4.87% | -4.25% | -2.32% | 4.99% | Quarterly | ETF | Equity Australia Large Blend | 4 |
|
| [IOZ] iShares Core S&P/ASX 200 ETF | 1,255.47 | 29.47 | 0.15% | 0.07% | 4.21% | -3.92% | 2.34% | 3.84% | Semi-Annual | ETF | Equity Australia Large Blend | 5 |
|
| [ISO] iShares S&P/ASX Small Ordinaries ETF | 82.15 | 3.15 | 0.55% | 0.30% | 4.96% | -2.98% | 14.12% | 2.10% | Semi-Annual | ETF | Equity Australia Mid/Small Blend | 2 |
|
| [MVE] VanEck Vectors S&P/ASX MidCap ETF | 68.18 | 8.15 | 0.45% | 0.15% | 8.97% | -3.87% | 10.97% | 3.76% | Semi-Annual | ETF | Equity Australia Mid/Small Blend | 3 |
|
| [MVS] VanEck Vectors Small Coms Masters ETF | 67.25 | 0.04 | 0.49% | 0.32% | 5.78% | -1.88% | 8.46% | 3.22% | Semi-Annual | ETF | Equity Australia Mid/Small Blend | 3 |
|
| [MVW] VanEck Vectors Australian Equal Wt ETF | 447.00 | 49.70 | 0.35% | 0.08% | 9.69% | -3.67% | 6.97% | 3.19% | Semi-Annual | ETF | Equity Australia Large Blend | 4 |
|
| [QOZ] BetaShares FTSE RAFI Australia 200 ETF | 255.45 | -41.91 | 0.40% | 0.11% | 13.58% | -4.46% | 1.51% | 4.20% | Semi-Annual | ETF | Equity Australia Large Blend | 4 |
|
| [SFY] SPDR? S&P/ASX 50 ETF | 472.46 | 11.35 | 0.29% | 0.06% | 4.23% | -4.24% | -0.31% | 5.06% | Quarterly | ETF | Equity Australia Large Blend | 4 |
|
| [SSO] SPDR? S&P/ASX Small Ordinaries ETF | 18.85 | 2.94 | 0.50% | 0.25% | 4.29% | -2.92% | 14.42% | 2.49% | Semi-Annual | ETF | Equity Australia Mid/Small Blend | 2 |
|
| [STW] SPDR? S&P/ASX 200 ETF | 3,511.15 | 95.43 | 0.19% | 0.04% | 10.21% | -3.90% | 2.43% | 4.55% | Quarterly | ETF | Equity Australia Large Blend | 5 |
|
| [VAS] Vanguard Australian Shares ETF | 2,533.68 | -6.68 | 0.14% | 0.05% | 7.28% | -3.80% | 2.74% | 3.78% | Quarterly | ETF | Equity Australia Large Blend | 5 |
|
| [VLC] Vanguard MSCI Australian Large Coms ETF | 77.66 | 0.04 | 0.20% | 0.06% | 4.43% | -4.74% | -2.08% | 4.57% | Quarterly | ETF | Equity Australia Large Blend | 4 |
|
| [VSO] Vanguard MSCI Australian Small Coms ETF | 153.69 | 17.72 | 0.30% | 0.11% | 8.34% | -2.30% | 12.72% | 3.72% | Semi-Annual | ETF | Equity Australia Mid/Small Blend | 3 |
|
| [ZOZI] ETFS S&P/ASX 100 ETF | 8.25 | 0.01 | 0.24% | 0.18% | 2.92% | -3.91% | 1.37% | 5.15% | Quarterly | ETF | Equity Australia Large Blend | 3 |
|
| Equities - Sector | |||||||||||||
| [MVB] VanEck Vectors Australian Banks ETF | 28.87 | 2.13 | 0.28% | 0.11% | 8.77% | -5.51% | -6.79% | 5.89% | Tri-Annual | ETF | Equity Australia Other | 3 |
|
| [MVR] VanEck Vectors Australian Resources ETF | 81.46 | 46.27 | 0.35% | 0.14% | 27.84% | -3.83% | 19.61% | 3.06% | Semi-Annual | ETF | Equity Australia Other | 3 |
|
| [OZF] SPDR? S&P/ASX 200 Fincls EX A-REIT ETF | 58.93 | -10.32 | 0.40% | 0.09% | 5.96% | -6.01% | -9.34% | 5.16% | Semi-Annual | ETF | Equity Australia Other | 4 |
|
| [OZR] SPDR? S&P/ASX 200 Resources ETF | 59.26 | 3.03 | 0.40% | 0.15% | 11.33% | -4.32% | 17.49% | 2.23% | Semi-Annual | ETF | Equity Australia Other | 3 |
|
| [QFN] BetaShares S&P/ASX200 Fincls Sect ETF | 13.75 | -18.35 | 0.39% | 0.12% | 66.26% | -6.00% | -7.01% | 4.15% | Semi-Annual | ETF | Equity Australia Other | 3 |
|
| [QRE] BetaShares S&P/ASX200 Res Sect ETF | 117.83 | 44.65 | 0.39% | 0.23% | 170.97% | -4.30% | 17.45% | 1.40% | Semi-Annual | ETF | Equity Australia Other | 3 |
|
| Equities - Strategy | |||||||||||||
| [AUMF] iShares Edge MSCI Australia Mltfctr ETF | 7.73 | 1.17 | 0.30% | 0.22% | 11.35% | -3.50% | 6.43% | 4.27% | Semi-Annual | ETF | Equity Australia Large Blend | 2 |
|
| [AUST] BetaShares Managed Risk Australian Share | 24.90 | 0.16 | 0.49% | 0.11% | 5.30% | -4.09% | 1.12% | 4.30% | Semi-Annual | MF | Equity Australia Large Blend | NR |
|
| [BBOZ] BetaShares Australian Eqs Strong BearHdg | 83.00 | -16.67 | 1.38% | 0.13% | 48.45% | 11.24% | -1.69% | 0.00% | Annual | MF | Alternative Strategies | NR |
|
| [BEAR] BetaShares Aus Equities Bear Hedge | 53.95 | -4.22 | 1.38% | 0.11% | 22.02% | 4.81% | -0.20% | 0.00% | Annual | MF | Alternative Strategies | NR |
|
| [DIV] UBS IQ Morningstar Australia Div Yld ETF | 26.24 | 0.11 | 0.30% | 0.19% | 1.98% | -6.98% | -1.30% | 4.20% | Quarterly | ETF | Equity Australia Large Growth | 3 |
|
| [ETF] UBS IQ Morningstar Australia Quality ETF | 8.19 | -2.07 | 0.30% | 0.12% | 1.73% | -5.14% | 2.82% | 1.52% | Semi-Annual | ETF | Equity Australia Large Blend | 3 |
|
| [FDIV] VanEck Vectors S&P/ASX Franked Div ETF | 3.68 | 0.01 | 0.35% | 0.14% | 10.75% | -5.43% | -4.16% | 5.81% | Quarterly | ETF | Equity Australia Large Blend | 3 |
|
| [GEAR] BetaShares Geared Australian Equity(Hdg) | 69.87 | 18.72 | 0.80% | 0.13% | 47.18% | -9.21% | 0.61% | 7.11% | Semi-Annual | MF | Equity Australia Large Geared | NR |
|
| [IHD] iShares S&P/ASX Dividend Opps ETF | 251.36 | 0.21 | 0.30% | 0.11% | 3.50% | -5.90% | -3.41% | 5.18% | Quarterly | ETF | Equity Australia Large Value | 4 |
|
| [MVOL] iShares Edge MSCI Australia Mini Vol ETF | 6.33 | 0.00 | 0.30% | 0.16% | 3.33% | -3.77% | 2.64% | 4.75% | Semi-Annual | ETF | Equity Australia Large Blend | 3 |
|
| [RARI] Russell Inv Australian Rspnb Inv ETF | 68.38 | 6.29 | 0.45% | 0.23% | 3.71% | -4.19% | -0.69% | 5.53% | Semi-Annual | ETF | Equity Australia Large Value | 3 |
|
| [RDV] Russell Inv High Dividend Aus Shrs ETF | 279.96 | 10.92 | 0.34% | 0.09% | 3.83% | -6.89% | -1.81% | 6.70% | Quarterly | ETF | Equity Australia Large Value | 4 |
|
| [RVL] Russell Inv Australian Value ETF | 12.82 | 0.04 | 0.34% | 0.07% | 8.43% | -8.83% | -5.33% | 4.64% | Semi-Annual | ETF | Equity Australia Large Value | 3 |
|
| [SMLL] BetaShares Australian Small Coms Sel | 19.70 | 4.67 | 0.39% | 0.50% | 11.43% | -2.53% | 0.00% | 1.22% | Semi-Annual | MF | Equity Australia Mid/Small Blend | NR |
|
| [SWTZ] Switzer Dividend Growth | 75.60 | 2.18 | 0.89% | 0.49% | 3.78% | -4.91% | -2.51% | 3.87% | Quarterly | MF | Equity Australia Large Growth | NR |
|
| [SYI] SPDR? MSCI Australia Sel Hi Div Yld ETF | 178.35 | 0.19 | 0.35% | 0.07% | 9.08% | -4.74% | -2.97% | 4.93% | Quarterly | ETF | Equity Australia Large Value | 4 |
|
| [UBA] UBS IQ MSCI Australia Ethical ETF | 176.13 | 7.23 | 0.17% | 0.09% | 1.64% | -4.32% | 0.83% | 4.14% | Semi-Annual | ETF | Equity Australia Large Blend | 4 |
|
| [VHY] Vanguard Australian Shares High Yld ETF | 1,014.03 | 57.74 | 0.25% | 0.08% | 6.18% | -6.33% | -2.23% | 8.06% | Quarterly | ETF | Equity Australia Large Blend | 4 |
|
| [YMAX] BetaShares Aus Top 20 Eq Yld Maxmsr | 381.90 | -1.14 | 0.79% | 0.19% | 4.63% | -3.41% | -1.20% | 9.11% | Quarterly | MF | Equity Australia Large Blend | NR |
|
| [ZYAU] ETFS S&P/ASX 300 High Yield Plus ETF | 51.37 | 9.95 | 0.35% | 0.16% | 12.10% | -4.03% | 4.61% | 10.13% | Quarterly | ETF | Equity Australia Large Blend | 3 |
|
| [HVST] BetaShares Australian Div Harvester(mgd) | 208.52 | -41.12 | 0.90% | 0.12% | 13.38% | -6.41% | -16.10% | 11.91% | Monthly | MF | Equity Australia Large Value | NR |
|
| [KSM] K2 Australian Small Cap Fund | 15.47 | -0.60 | 2.70% | 1.32% | 1.55% | -3.62% | 12.11% | 9.83% | Annual | MF | Alternative Strategies | NR |
|
| [FAIR] BetaShares Australian Sustnby Ldrs ETF | 98.67 | 46.76 | 0.49% | 0.15% | 24.16% | -1.16% | 0.00% | 0.24% | Semi-Annual | ETF | Equity Australia Large Blend | 3 |
|
| [EINC] BetaShares Legg Mason Equity Income Fund | 7.22 | 7.41 | 0.85% | 0.35% | 6.11% | 0.00% | 0.00% | 0.00% | Quarterly | MF | Equity Australia Large Value | NR |
|
Source: ASX and Morningstar
Figure 69: Equity ETFs Global
| Name | Total FUM ($M) | Qtr Flows ($M) | MER | Avg Spread | Avg Liquidity | 3MTH Return | 12MTH Return | Yield | Frequency | Structure | Sub Category | STAR Rating | |
|---|---|---|---|---|---|---|---|---|---|---|---|---|---|
| GLOBAL | |||||||||||||
| Equities - Broad | |||||||||||||
| [IHOO] iShares Global 100 AUD Hedged ETF | 35.15 | 0.00 | 0.43% | 0.44% | 5.88% | -3.19% | 10.34% | 11.69% | Annual | ETF | Equity World - Currency Hedged | 2 |
|
| [IHWL] iShares Core MSCI World All Cap AUDH ETF | 11.44 | 2.65 | 0.19% | 0.38% | 13.82% | -2.04% | 10.99% | 1.11% | Semi-Annual | ETF | Equity World - Currency Hedged | 2 |
|
| [IOO] iShares Global 100 ETF (AU) | 1,332.56 | 12.68 | 0.40% | 0.13% | 3.18% | 0.08% | 13.29% | 1.91% | Semi-Annual | ETF | Equity World Large Blend | 4 |
|
| [IVE] iShares MSCI EAFE ETF (AU) | 316.06 | 9.81 | 0.33% | 0.19% | 5.50% | 0.22% | 13.83% | 2.19% | Semi-Annual | ETF | Equity World Large Blend | 3 |
|
| [IWLD] iShares Core MSCI World All Cap ETF | 22.54 | 2.54 | 0.16% | 0.40% | 7.83% | 1.05% | 13.28% | 1.46% | Semi-Annual | ETF | Equity World Large Blend | 2 |
|
| [KII] K2 Global Equities Fund (Hedge Fund) | 17.81 | -2.24 | 2.70% | 1.33% | 4.42% | -1.79% | 11.38% | 0.00% | Quarterly | MF | Alternative Strategies | NR |
|
| [MGE] Magellan Global Equities | 988.79 | 24.63 | 1.35% | 0.40% | 3.17% | 0.65% | 13.38% | 1.68% | Annual | MF | Equity World Large Blend | NR |
|
| [MHG] Magellan Global Equities Currency Hdg | 63.97 | 3.56 | 1.35% | 0.50% | 3.07% | -1.83% | 13.08% | 1.70% | Annual | MF | Equity World - Currency Hedged | NR |
|
| [QUAL] VanEck Vectors MSCI Wld ex Aus Qlty ETF | 339.78 | 18.96 | 0.40% | 0.13% | 7.76% | 1.83% | 15.68% | 2.90% | Annual | ETF | Equity World Large Blend | 4 |
|
| [UBW] UBS IQ MSCI World ex Australia Ethcl ETF | 27.00 | 1.98 | 0.35% | 0.25% | 4.56% | 0.72% | 13.22% | 1.79% | Annual | ETF | Equity World Large Blend | 2 |
|
| [VEU] Vanguard All-World ex-US Shares ETF | 1,176.98 | 88.69 | 0.11% | 0.12% | 4.48% | 1.46% | 16.08% | 2.34% | Quarterly | ETF | Equity World Large Blend | 4 |
|
| [VGAD] Vanguard MSCI Index Intl (Hdg) ETF | 385.65 | 29.68 | 0.21% | 0.09% | 8.85% | -2.38% | 10.80% | 5.08% | Semi-Annual | ETF | Equity World - Currency Hedged | 4 |
|
| [VGS] Vanguard MSCI Index Intl ETF | 940.55 | 120.71 | 0.18% | 0.07% | 9.26% | 0.73% | 13.28% | 2.66% | Quarterly | ETF | Equity World Large Blend | 4 |
|
| [WXHG] SPDR? S&P World ex Australia(Hedged) ETF | 78.52 | 2.33 | 0.35% | 0.23% | 3.73% | -2.36% | 11.07% | 2.94% | Annual | ETF | Equity World - Currency Hedged | 3 |
|
| [WXOZ] SPDR? S&P World ex Australia ETF | 166.80 | 3.54 | 0.30% | 0.18% | 1.56% | 0.76% | 13.63% | 2.19% | Annual | ETF | Equity World Large Blend | 3 |
|
| [PIXX] Platinum International (Quoted Mngd Hdg) | 185.17 | 60.55 | 1.10% | 0.33% | 15.04% | 0.83% | 0.00% | 0.00% | Annual | MF | Equity World Large Blend | NR |
|
| Equities - Sector | |||||||||||||
| [BNKS] BetaShares Glb Banks ETF-Ccy Hdg | 75.12 | 5.14 | 0.57% | 0.29% | 21.59% | -2.18% | 11.32% | 2.13% | Semi-Annual | ETF | Equity World Other | 3 |
|
| [DRUG] BetaShares Glb Healthcare ETF-Ccy Hdg | 21.48 | -2.11 | 0.57% | 0.39% | 22.13% | -2.44% | 6.90% | 0.31% | Semi-Annual | ETF | Equity World Other | 2 |
|
| [FOOD] BetaShares Glb Agltr Coms ETF-Ccy Hdg | 17.32 | 1.19 | 0.57% | 0.40% | 21.15% | -5.50% | 7.91% | 1.12% | Semi-Annual | ETF | Equity World Other | 2 |
|
| [FUEL] BetaShares Glb Energy Coms ETF-Ccy Hdg | 15.94 | 4.61 | 0.57% | 0.36% | 31.53% | -3.82% | 3.95% | 3.95% | Semi-Annual | ETF | Equity Global Resources | 2 |
|
| [GDX] Market Vectors Gold Miners ETF | 67.16 | 6.90 | 0.53% | 0.35% | 8.29% | -3.71% | -3.28% | 0.67% | Annual | ETF | Equity Global Resources | 2 |
|
| [HACK] Betashares Global Cybersecurity ETF | 64.92 | 4.90 | 0.67% | 0.32% | 10.41% | 10.49% | 14.70% | 2.30% | Semi-Annual | ETF | Equity Global Technology | 2 |
|
| [IXI] iShares Global Consumer Staples ETF (AU) | 108.47 | -8.18 | 0.47% | 0.38% | 4.26% | -3.63% | 2.57% | 1.92% | Semi-Annual | ETF | Equity World Other | 3 |
|
| [IXJ] iShares Global Healthcare ETF (AU) | 482.33 | -2.11 | 0.47% | 0.34% | 3.34% | 0.71% | 9.05% | 1.25% | Semi-Annual | ETF | Equity World Other | 3 |
|
| [IXP] iShares Global Telecom ETF (AU) | 47.43 | 0.38 | 0.47% | 0.67% | 3.43% | -3.94% | -1.22% | 3.02% | Semi-Annual | ETF | Equity World Other | 2 |
|
| [MNRS] BetaShares Glb Gold Miners ETF-Ccy Hdg | 4.97 | 0.00 | 0.57% | 0.67% | 15.84% | -6.38% | -11.13% | 0.47% | Semi-Annual | ETF | Equity Global Resources | 1 |
|
| [ROBO] ETFS ROBO Glbl Robotics and Atmtn ETF | 75.95 | 31.74 | 0.69% | 0.29% | 23.45% | 2.69% | 0.00% | 0.00% | Annual | ETF | Equity Global Technology | 2 |
|
| Equities - Strategy | |||||||||||||
| [DMKT] AMP Capital Dynamic Markets ETF (Hedge) | 26.84 | 2.51 | 0.50% | 0.67% | 4.71% | -2.44% | 2.25% | 5.04% | Semi-Annual | MF | Multisector Balanced | NR |
|
| [ETHI] BetaShares Global Sstnbty Ldrs ETF | 168.54 | 40.44 | 0.59% | 0.27% | 12.50% | 4.11% | 18.60% | 1.29% | Semi-Annual | ETF | Equity World Large Blend | 3 |
|
| [GROW] Schroder Real Return ETF | 45.53 | 1.13 | 0.90% | 0.54% | 4.56% | -0.27% | 3.16% | 2.59% | Semi-Annual | MF | Multisector Balanced | NR |
|
| [MOAT] Market Vectors Morningstar Wide Moat ETF | 52.74 | 2.44 | 0.49% | 0.32% | 5.37% | -0.42% | 10.89% | 0.92% | Annual | ETF | Equity North America | 3 |
|
| [QMIX] SPDR? MSCI World Quality Mix | 8.08 | 0.92 | 0.40% | 0.28% | 5.19% | 0.22% | 12.71% | 2.28% | Semi-Annual | ETF | Equity World Large Blend | 2 |
|
| [TECH] ETFS Morningstar Global Technology ETF | 43.71 | 12.69 | 0.45% | 0.30% | 19.99% | 8.91% | 0.00% | 0.79% | Semi-Annual | ETF | Equity Global Technology | 2 |
|
| [WDIV] SPDR? S&P Global Dividend ETF | 168.81 | 9.68 | 0.50% | 0.22% | 7.70% | -1.03% | 8.55% | 4.01% | Semi-Annual | ETF | Equity World Large Value | 3 |
|
| [WDMF] iShares Edge MSCI World Multifactor ETF | 28.59 | 4.99 | 0.35% | 0.42% | 7.37% | 2.24% | 19.49% | 4.39% | Semi-Annual | ETF | Equity World Large Blend | 2 |
|
| [WRLD] BetaShares Managed Risk Global Share | 29.91 | -11.65 | 0.54% | 0.25% | 20.17% | 0.05% | 11.36% | 1.01% | Annual | MF | Multisector Aggressive | NR |
|
| [WVOL] iShares Edge MSCI World Minimum Vol ETF | 9.85 | -2.20 | 0.30% | 0.59% | 21.00% | -0.73% | 7.97% | 2.59% | Semi-Annual | ETF | Equity World Large Blend | 2 |
|
| [MOGL] Montgomery Global Equities (Managed Fd) | 71.78 | 8.39 | 1.32% | 0.45% | 9.51% | 2.23% | 0.00% | 0.00% | Semi-Annual | MF | Equity World Large Blend | NR |
|
| [ESGI] VanEck Vectors MSCI Intl Sust Eq ETF | 4.02 | 4.02 | 0.55% | 0.34% | 58.31% | 0.00% | 0.00% | 0.00% | Annual | ETF | Equity World Large Blend | 1 |
|
| [WRLD] BetaShares Managed Risk Global Share | 42.27 | -2.37 | 0.54% | 0.18% | 5.39% | 11.99% | 0.99% | 12.30% | Multisector Aggressive | 3 |
|||
| [WVOL] iShares Edge MSCI World Minimum Vol ETF | 12.40 | 0.00 | 0.30% | 0.46% | 5.44% | 8.87% | 2.49% | 4.68% | Equity World Large Blend | 2 |
|||
| [MOGL] Montgomery Global Equities Fund (Managed Fund) | 62.58 | 62.58 | 1.89% | 0.28% | 0.00% | 0.00% | 0.00% | 14.35% | Equity World Large Value | 1 |
|||
Source: ASX and Morningstar
Glossary
Bid-offer spread: is the bid o er spread is the diference between the highest price that a buyer is willing to pay and the lowest price a seller is willing to sell at.
Commodity: A raw material or primary agricultural product that can be bought and sold.
Currency Hedging: is a risk management technique companies can use to hedge their foreign exchange risk usually using forward contracts and options.
Derivative: A derivative is a contract that derives its value from an underlying asset.
Diversifed: Diversification is a way of managing risk by investing in a variety of lowly correlated securities.
Domicile: The legal home country of a company.
Equal Weighted: Means that each stock is given the same weight in a portfolio.
ETF: An ETF is an investment fund that is traded on a stock exchange, tracking an index.
Floating rate securities: An investment with variable interest payments based on a floating rate.
Flows: The amount of money coming into or out of a fund.
Fully replicating: An ETF that tracks the benchmark index by holding all the stocks in the index.
Funds under Management (FUM): The market value of the assets which a fund manages on behalf of investors.
Hidden liquidity: Refers to the stock of units held by the Market Makers. Their job is to ensure suficient liquidity is available during market hours around the ETFs NAV. It is referred to as ‘hidden’ as they will tend to only place volume on the screen as required.
Leverage: Using debt to finance assets.
Liquidity: Describes the degree to which an asset or security can be quickly bought or sold in the market without affecting the asset’s price.
Managed Funds (MF): If you invest in a managed fund your money, along with those of other investors will be collectively invested by an investment team in various assets.
Management Expense Ratio (MER): A fee charged to the assets of a fund used to pay for the costs of running the fund.
Market Capitalisation: The number of shares outstanding multiplied by the share price
Multisector aggressive: Funds that invest in a number of sectors and are heavily weighted towards growth assets
Multi sector asset allocation: Funds that invest across a number of sectors.
On screen liquidity: Simply refers to the publicly quoted bid and offers you see when you look at a trading screen.
Optimised/partially replicating: As opposed for fully replicating, partially replicating ETFs track the benchmark index without holding all the stocks in the index.
PDS: Product disclosure statement is a document, or sometimes a group of documents, that contains information about a financial product including any significant benefits and risks, the cost of the financial product and the fees and charges that the nancial product issuer may receive.
Prospectus: A Prospectus is a formal legal document that is issued upon on listing on an exchange. It outlines how the raised money will be used and should contain all the information required for investors to make an informed decision.
Security: A tradeable financial asset.
Separately Managed Account (SMA): An SMA is an investment account managed to a model portfolio that is controlled by a portfolio manager. Unlike a managed fund, an SMA is not a pooled investment, everyone’s funds are not in the same bucket. You have your own account and you are the beneficial owner of the stocks held in that account.
Spread: The difference between the price at which someone is willing to buy a security and the price at which someone is willing to sell a security.
Star Rating: InvestSMART’s star rating is a measure of key quantifiable metrics for ETFs: size, fees, liquidity, spread, tracking error.
Structured Products (SP): This refers to a security or derivative which gives financial exposure to the performance of an underlying instrument. Types of structured products include Exchange Traded Commodities (ETCs) and Exchange Traded Notes (ETNs).
Tracking difference: The difference in returns of ETF to its Benchmark for a given period
Tracking error: Refers to the volatility of the tracking difference
Underlying liquidity: Refers to the liquidity in the underlying market that the ETF is designed to track. Underlying liquidity is the most important measure of liquidity when reviewing an ETF. You will find that the less liquid the underlying index, the wider the on-market bid-ask spread tends to be to account for the transactional costs involved in dealing.
Yield: The income return on an investment, such as interest or dividends received from holding it. Yield is usually expressed as an annual percentage rate.
IMPORTANT: This information is general advice only and has been prepared without considering your financial situation or objectives and you should consider if the information is appropriate for your circumstances before making an investment decision. Before acting on this information, please ensure that you read all relevant disclosure documents, including but not limited to, the Product Disclosure Statement (PDS) and Financial Services Guide (FSG). You may wish to speak to a financial advisor for further guidance. Numerical gures presented are accurate at the time of preparation and where required, further disclosure will be appropriately provided. Past performance cannot be relied upon for future performance. Information presented, gures quoted and diagrams are accurate as at 31 December 2017. Exchange listed managed funds are included in this report but not rated. Before making any investment decisions, please read the latest PDS provided by each ETF issuer and check all relevant ETF fees, as they are subject to change without notice.


Frequently Asked Questions about this Article…
The InvestSMART Australian Exchange-Traded Products Quarterly Report aims to provide investors with an easy-to-understand overview of market activity and insights into how InvestSMART builds its Separately Managed Account (SMA) portfolios using Exchange Traded Funds (ETFs).
The InvestSMART Star Rating system evaluates ETFs based on key metrics such as size, fees, liquidity, spread, and tracking error. It provides a quantitative measure to help investors compare ETFs with similar objectives, although it does not account for individual investment goals.
According to ASIC, passive funds aim to replicate or track the performance of an index or benchmark, while active funds use an investment strategy to outperform a particular benchmark. The distinction helps investors understand the management style and potential risks associated with each type of fund.
ETFs are popular because they offer a low-cost, transparent, and hassle-free way for investors to achieve their investment objectives. They provide diversification and exposure to specific investment themes, making them an attractive option for many investors.
When evaluating an ETF's performance, investors should consider the tracking difference and tracking error, which indicate how closely the ETF tracks its benchmark. Lower tracking differences and errors suggest better performance in replicating the benchmark.
The domicile of an ETF affects investors primarily in terms of tax implications. Internationally domiciled ETFs may require investors to fill out additional tax forms, such as the W8-BEN form, to benefit from reduced withholding taxes.
Key factors in ETF due diligence include understanding the fund's exposure, performance, structure, domicile, liquidity, and total cost of ownership. These factors help investors assess whether an ETF aligns with their investment goals and risk tolerance.
During the March 2018 quarter, the Australian ETP market saw growth in funds under management despite a slight decline due to negative equity market performance. Notable trends included strong inflows into global and domestic large-cap equity products and the launch of new funds by BetaShares and VanEck.


