Diversified Portfolios - InvestSMART High Growth - 31 December 2016
COMMENTARY
PORTFOLIO COMMENTARY
The year in review. There was no shortage of events that had the potential to impact markets during 2016. The year started off as one of the worst on record with markets down around 10% by around February as concerns around a slowdown in China and the global economy in general combined with high valuations impacted markets. Markets shook off this initial wobble as it became evident that central banks would remain accommodative to stimulate growth. As a consequence we saw bond yields fall to historically low levels during the course of the year and in some countries to the unprecedented situation of negative interest rates. In Australia, we saw the RBA’s official cash rate drop to a record low of 1.50%.
Given a low-yield environment the year was generally characterised by “yield assets” such as property and infrastructure or “quality growth” companies with stable and predictable cash flows (think health care stocks) doing well for the first part of the year. This saw the valuations of these assets bid-up to over-valued levels, until however in the latter part of the year, the prospects of higher inflation saw these assets sell off quite heavily in September through to November.
Political events also played their part in markets during the year, with the uncertainty of these events generally weighing on market sentiment until the results were known. Most notably we saw the UK’s decision to leave the European Union. While the result came as a surprise to many, markets initially reacted unfavourably only to recover just a few days later. In the latter part of the year the US election was the main pre-occupation with a surprise Trump victory and an even more surprising positive market reaction on the basis that a Trump administration might be more positive from an infrastructure and tax-reform perspective that have the potential to be more inflationary.
Despite all that has happened during 2016, the actual outcomes from most asset classes has been reasonably positive, with the major asset classes returning between 2% - 13% for the year. Cash returned 2.1% for the year while Australian bonds and global bonds returned 2.9% and 5.2% respectively. Australian equities returned a respectable 11.8%, developed international equities returned 7.9% and emerging markets returned 11.7%. Australian REITs returned 13.2% while global REITs and global infrastructure delivered 6.3% and 12.6% respectively.
Despite a generally positive outcome across major asset classes for the year, diversification across asset classes remains an important part of any investment strategy. We face 2017 with many issues from 2016 still unresolved (e.g. Brexit), the uncertainty (both positive or negative) of an incoming Trump administration and further political uncertainty from a number of elections in Europe as populism movements get tested in those regions. Given the binary outcomes of some of these events it has the potential to be very negative or positive for markets therefore diversification remains as appropriate as ever.
The InvestSMART High Growth Portfolio returned 8.4% for the year, buoyed by its overweight to Australian equities. Exposures to Australian REITs also contributed positively to performance as did the exposure to the Macquarie Income Opportunities Fund within fixed interest, which returned 4.1% for the year when Australian bonds returned 2.9% generally.
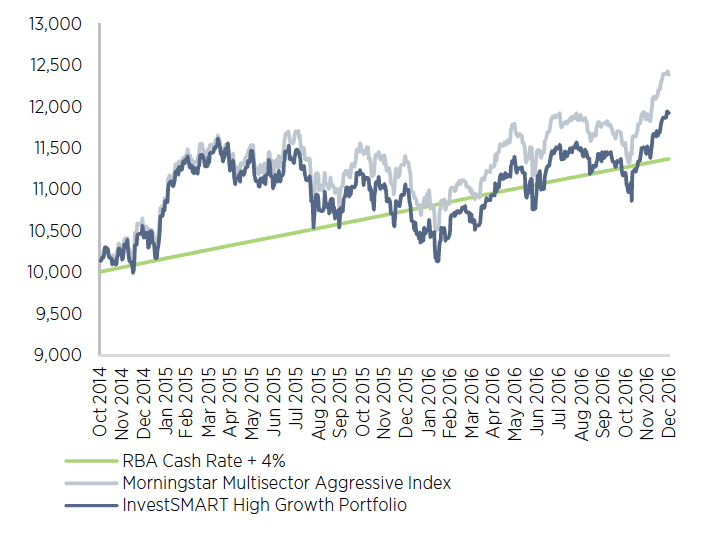
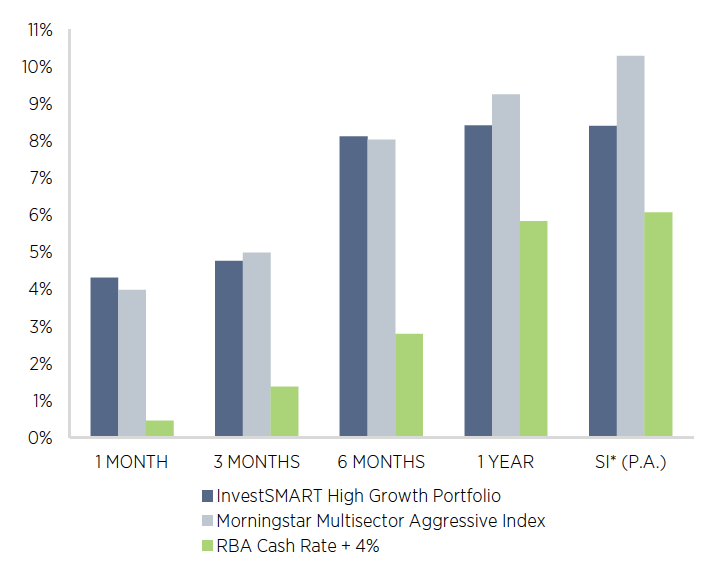
The portfolio continues to track ahead of its Cash 4% objective, being ahead of its objective by 2.6% for the year and 2.3% since inception.
Growth of $10,000
Income Reinvested

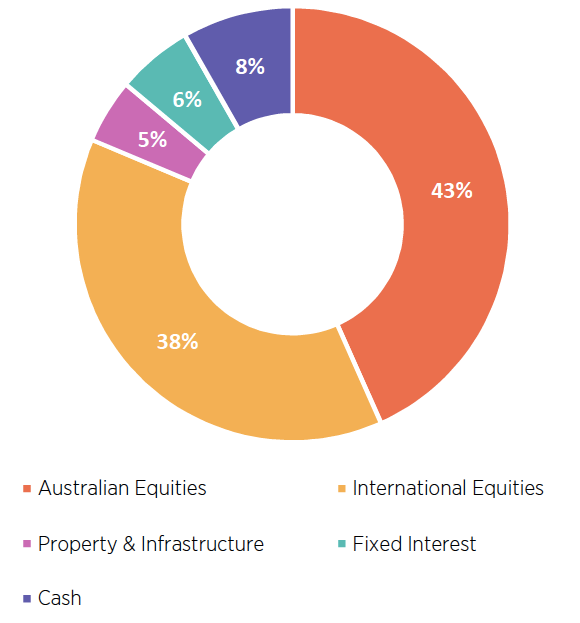
Asset Allocation as at 31 DECEMber 2016

Source: Praemium, RBA
Returns are after fees and before expenses. Returns are shown as annualised if the period is over 1 year. * Since Inception (SI) date is 24 October 2014.
| PERFORMANCE TO 31 DECEMBER 2016 | 1 MONTH | 3 MONTH | 6 MONTH | 1 YEAR | SI* (P.A.) |
|---|---|---|---|---|---|
| InvestSMART High Growth Portfolio | 4.31% | 4.76% | 8.12% | 8.41% | 8.40% |
| Morningstar Multisector Agressive Index | 3.98% | 4.99% | 8.03% | 9.25% | 10.29% |
| Excess to Benchmark | 0.33% | -0.22% | 0.09% | -0.84% | -1.89% |
| RBA Cash Rate 4% | 0.46% | 1.38% | 2.79% | 5.83% | 6.07% |
| Excess to Objective | 3.85% | -3.39% | -5.33% | 2.58% | 2.33% |
Performance Summary to 31 December 2016

Portfolio Objective
The investment objective is to achieve a return of 4% above the RBA Cash rate per annum over ten year rolling periods by investing in a diverse mix of asset classes covering Australian equities, international equities, property, infrastructure, alternatives, fixed interest and cash.
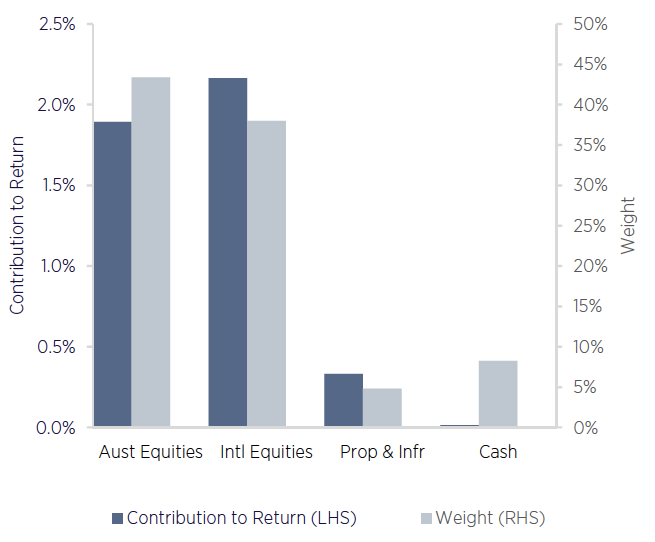
Contribution to Return 1 Month to 31 December

Important Information
While every care has been taken in preparation of this document, InvestSMART Financial Services Limited (ABN 70 089 038 531, AFSL 226435) (“InvestSMART”) makes no representations or warranties as to the accuracy or completeness of any statement in it including, without limitation, any forecasts. Past performance is not a reliable indicator of future performance. This document has been prepared for the purpose of providing general information, without taking account of any particular investor’s objectives, financial situation or needs. An investor should, before making any investment decisions, consider the appropriateness of the information in this document, and see professional advice, having regard to the investor’s objectives, financial situation and needs. This document is solely for the use of the party to whom it is provided. This document has been prepared for InvestSMART by InvestSense Pty Ltd ABN 31 601 876 528, Authorised Representative of Sentry Asset Management Pty Ltd AFSL 408 800. Financial commentary contained within this report is provided by InvestSense Pty Ltd. The information contained in this document is not intended to be a definitive statement on the subject matter nor an endorsement that this model portfolio is appropriate for you and should not be relied upon in making a decision to invest in this product. The information in this report is general information only and does not take into account your individual objectives, financial situation, needs or circumstances. No representations or warranties express or implied, are made as to the accuracy or completeness of the information, opinions and conclusions contained in this report. In preparing this report, InvestSMART and InvestSense Pty Ltd has relied upon and assumed, without independent verification, the accuracy and completeness of all information available to us. To the maximum extent permitted by law, neither InvestSMART, InvestSense Pty Ltd or their directors, employees or agents accept any liability for any loss arising in relation to this report. The suitability of the investment product to your needs depends on your individual circumstances and objectives and should be discussed with your Adviser. Potential investors must read the PDS, Approved Product List and FSG along with any accompanying materials. Investment in securities and other financial products involves risk. An investment in a financial product may have the potential for capital growth and income, but may also carry the risk that the total return on the investment may be less than the amount contributed directly by the investor. Past performance of financial products is not a reliable indicator of future performance. InvestSense Pty Ltd does not assure nor guarantee the performance of any financial products offered. Information, opinions, historical performance, calculations or assessments of performance of financial products or markets rely on assumptions about tax, reinvestment, market performance, liquidity and other factors that will be important and may fluctuate over time. InvestSense Pty Ltd, InvestSMART Financial Services Limited, its associates and their respective directors and other staff each declare that they may, from time to time, hold interests in Securities that are contained in this investment product.
Frequently Asked Questions about this Article…
In 2016, markets were influenced by several major events, including concerns about a slowdown in China, global economic uncertainties, and political events like Brexit and the US election. These events initially caused market volatility, but markets eventually stabilized as central banks maintained accommodative policies.
The InvestSMART High Growth Portfolio returned 8.4% for the year 2016. This performance was supported by an overweight position in Australian equities and positive contributions from Australian REITs and the Macquarie Income Opportunities Fund.
Diversification is crucial because it helps manage risk by spreading investments across various asset classes. This approach can protect against market volatility and uncertainties, such as those experienced in 2016 with events like Brexit and the US election.
In 2016, Australian equities returned 11.8%, emerging markets returned 11.7%, and Australian REITs delivered 13.2%. These asset classes performed well despite the year's market volatility.
Political events such as Brexit and the US election initially caused market uncertainty and volatility. However, markets recovered quickly after these events, with the US election resulting in a surprisingly positive market reaction due to expectations of infrastructure and tax reforms.
The investment objective of the InvestSMART High Growth Portfolio is to achieve a return of 4% above the RBA Cash rate per annum over ten-year rolling periods by investing in a diverse mix of asset classes, including equities, property, infrastructure, and fixed interest.
In 2016, bond yields fell to historically low levels, with some countries experiencing negative interest rates. This low-yield environment led to increased valuations for yield assets like property and infrastructure, although these assets saw a sell-off later in the year due to inflation concerns.
Investors should be cautious when using past performance data, as it is not a reliable indicator of future performance. It's important to consider individual financial situations and seek professional advice before making investment decisions.


