Diversified Portfolios - InvestSMART High Growth - 30 September 2016
COMMENTARY
PORTFOLIO COMMENTARY
International equity markets were down for the month while Australian equities were up slightly. Over the quarter both international and Australian equities posted positive returns. There seems to be no shortage of issues that have the potential to impact markets in the short-term (US election, monetary policy from the US Fed, ECB and Japan, what's next for Brexit, European bank solvency). The real difficulty is ascertaining if or when any of these are a catalyst for anything more severe. We continue to remain focused on valuations of asset classes and their prospective returns with the view that should any of those short-term issues transpire into something more serious it is likely that the most over-valued asset classes are likely to be hit the hardest.
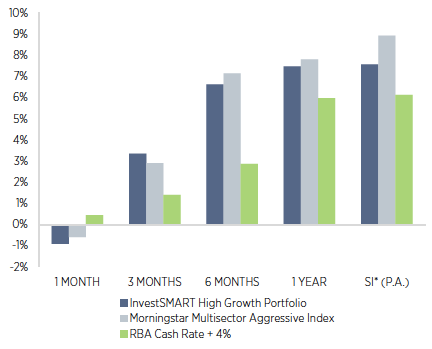
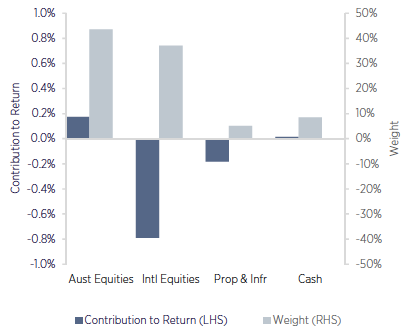
The InvestSMART High Growth Portfolio returned -0.9% over the month of September and 3.4% over the quarter. The overweight to Australian equities and underweight to property contributed positively to portfolio performance. The portfolio's exposure to international equities was the main detractor from portfolio performance. Within international equities, non-US equities generally fared better than US equities which is a positive for the portfolio as we are underweight US equities.
A-REITs posted their second month of negative returns with the portfolio's exposure down -4.3% in September. Global REITs fared slightly better but still posted a negative return of -3.0% for the month. During September we reduced the portfolio's exposure to REITs by around 2% on the basis that we view valuations in the REIT sector at the more expensive end. While REITs continue to offer reasonably attractive yields with modest growth prospects we believe that asset classes such as REITs and infrastructure are being treated like bond-proxies and are likely to be more sensitive to interest rates. In addition, once franking credits are taken into account, the broader Australian equity market offers a more attractive yield with relatively better valuations.
Within fixed interest the portfolio's exposure to Macquarie Income Opportunities Fund contributed positively by outperforming the broader bond market, returning 0.2% for the month and 2.1% over the quarter.
During September we removed iShares Europe ETF (IEU) and iShares MSCI Emerging Market ETF (IEM) and replaced them with the Vanguard FTSE Europe Shares ETF (VEQ) and the Vanguard FTSE Emerging Markets ETF (VGE) respectively. The switch was predominately due to the lower fee structure of the Vanguard ETFs.
PORTFOLIO POSITIONING
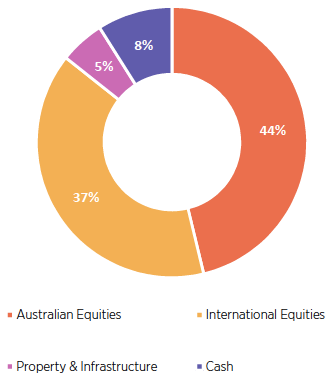
The portfolio remains overweight Australian equities on the basis that valuations appear reasonably compelling when compared to other asset classes and given the attractive yield characteristics of the asset class. The portfolio is expected to do well in an environment where Australian equities outperform other asset classes. Within international equities the portfolios have a bias towards emerging markets and an underweight to US equities, therefore the portfolio will benefit when US equities underperform broader equity markets and emerging markets do well.
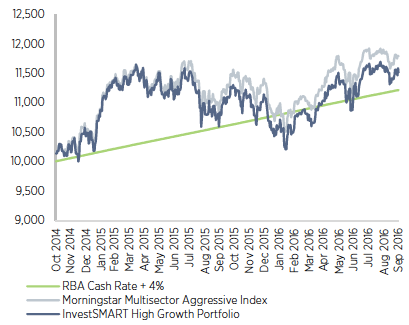
Current market pricing implies that the portfolio's RBA Cash Rate 4% objective is achievable over the long-term but only through a very high allocation to relatively volatile equity investments. This means that investors should be comfortable with a high degree of volatility, which could result in a short-term fall in the portfolio's value of around 28%.
Growth of $10,000
Income Reinvested

Asset Allocation as at 30 SEPTEMBER 2016

Source: Praemium, RBA
Returns are before expenses and fees. Returns are shown as annualised if the period is over 1 year. * Since Inception (SI) date is 24 October 2014.
Portfolio Objective
The investment objective is to achieve a return of 4% above the RBA Cash rate per annum over rolling ten year periods by investing in a diverse mix of asset classes covering Australian equities, international equities, property, infrastructure, alternatives, fixed interest and cash.
| PERFORMANCE TO 30 SEPTEMBER 2016 | 1 MONTH | 3 MONTH | 6 MONTH | 1 YEAR | SI* (P.A.) |
|---|---|---|---|---|---|
| InvestSMART High Growth Portfolio | -0.91% | 3.35% | 6.63% | 7.47% | 7.57% |
| Morningstar Multisector Agressive Index | -0.59% | 2.90% | 7.15% | 7.81% | 8.93% |
| Excess to Benchmark | -0.33% | 0.45% | -0.52% | -0.34% | -1.36% |
| RBA Cash Rate 4% | 0.45% | 1.40% | 2.87% | 5.97% | 6.13% |
| Excess to Objective | -1.36% | 1.95% | 3.77% | 1.50% | 1.44% |
Performance Summary to 30 September 2016

Contribution to Return 1 Month to 30 September 2016

Important Information
While every care has been taken in preparation of this document, InvestSMART Financial Services Limited (ABN 70 089 038 531, AFSL 226435) (“InvestSMART”) makes no representations or warranties as to the accuracy or completeness of any statement in it including, without limitation, any forecasts. Past performance is not a reliable indicator of future performance. This document has been prepared for the purpose of providing general information, without taking account of any particular investor’s objectives, financial situation or needs. An investor should, before making any investment decisions, consider the appropriateness of the information in this document, and see professional advice, having regard to the investor’s objectives, financial situation and needs. This document is solely for the use of the party to whom it is provided. This document has been prepared for InvestSMART by InvestSense Pty Ltd ABN 31 601 876 528, Authorised Representative of Sentry Asset Management Pty Ltd AFSL 408 800. Financial commentary contained within this report is provided by InvestSense Pty Ltd. The information contained in this document is not intended to be a definitive statement on the subject matter nor an endorsement that this model portfolio is appropriate for you and should not be relied upon in making a decision to invest in this product. The information in this report is general information only and does not take into account your individual objectives, financial situation, needs or circumstances. No representations or warranties express or implied, are made as to the accuracy or completeness of the information, opinions and conclusions contained in this report. In preparing this report, InvestSMART and InvestSense Pty Ltd has relied upon and assumed, without independent verification, the accuracy and completeness of all information available to us. To the maximum extent permitted by law, neither InvestSMART, InvestSense Pty Ltd or their directors, employees or agents accept any liability for any loss arising in relation to this report. The suitability of the investment product to your needs depends on your individual circumstances and objectives and should be discussed with your Adviser. Potential investors must read the PDS, Approved Product List and FSG along with any accompanying materials. Investment in securities and other financial products involves risk. An investment in a financial product may have the potential for capital growth and income, but may also carry the risk that the total return on the investment may be less than the amount contributed directly by the investor. Past performance of financial products is not a reliable indicator of future performance. InvestSense Pty Ltd does not assure nor guarantee the performance of any financial products offered. Information, opinions, historical performance, calculations or assessments of performance of financial products or markets rely on assumptions about tax, reinvestment, market performance, liquidity and other factors that will be important and may fluctuate over time. InvestSense Pty Ltd, InvestSMART Financial Services Limited, its associates and their respective directors and other staff each declare that they may, from time to time, hold interests in Securities that are contained in this investment product.
Frequently Asked Questions about this Article…
As of September 2016, the InvestSMART High Growth Portfolio returned -0.9% for the month and 3.4% over the quarter. The portfolio's performance was positively influenced by an overweight position in Australian equities and a reduced exposure to property.
The portfolio underperformed in September 2016 primarily due to its exposure to international equities, particularly US equities, which did not perform as well as non-US equities.
The portfolio's exposure to A-REITs resulted in a negative return of -4.3% in September, while global REITs posted a negative return of -3.0%. The portfolio reduced its REIT exposure by around 2% due to high valuations in the sector.
In September, the portfolio replaced the iShares Europe ETF (IEU) and iShares MSCI Emerging Market ETF (IEM) with the Vanguard FTSE Europe Shares ETF (VEQ) and the Vanguard FTSE Emerging Markets ETF (VGE) due to their lower fee structure.
The investment objective of the InvestSMART High Growth Portfolio is to achieve a return of 4% above the RBA Cash rate per annum over rolling ten-year periods by investing in a diverse mix of asset classes.
The portfolio's asset allocation, which is overweight in Australian equities and underweight in US equities, is designed to perform well when Australian equities outperform other asset classes and when US equities underperform.
Investing in the InvestSMART High Growth Portfolio involves a high degree of volatility, with potential short-term falls in value of around 28%. Investors should be comfortable with this level of risk.
The portfolio's exposure to infrastructure and REITs is considered sensitive to interest rates because these asset classes are often treated like bond-proxies, making them more susceptible to changes in interest rates.


